Yamazumi
山積み·yamazumi·"stacking, piling up"
Personalize This
Get insights for your role
A yamazumi is a stacked bar chart of work element times against takt time, used to reveal overburden, idle time, and line-balancing opportunities.
Definition
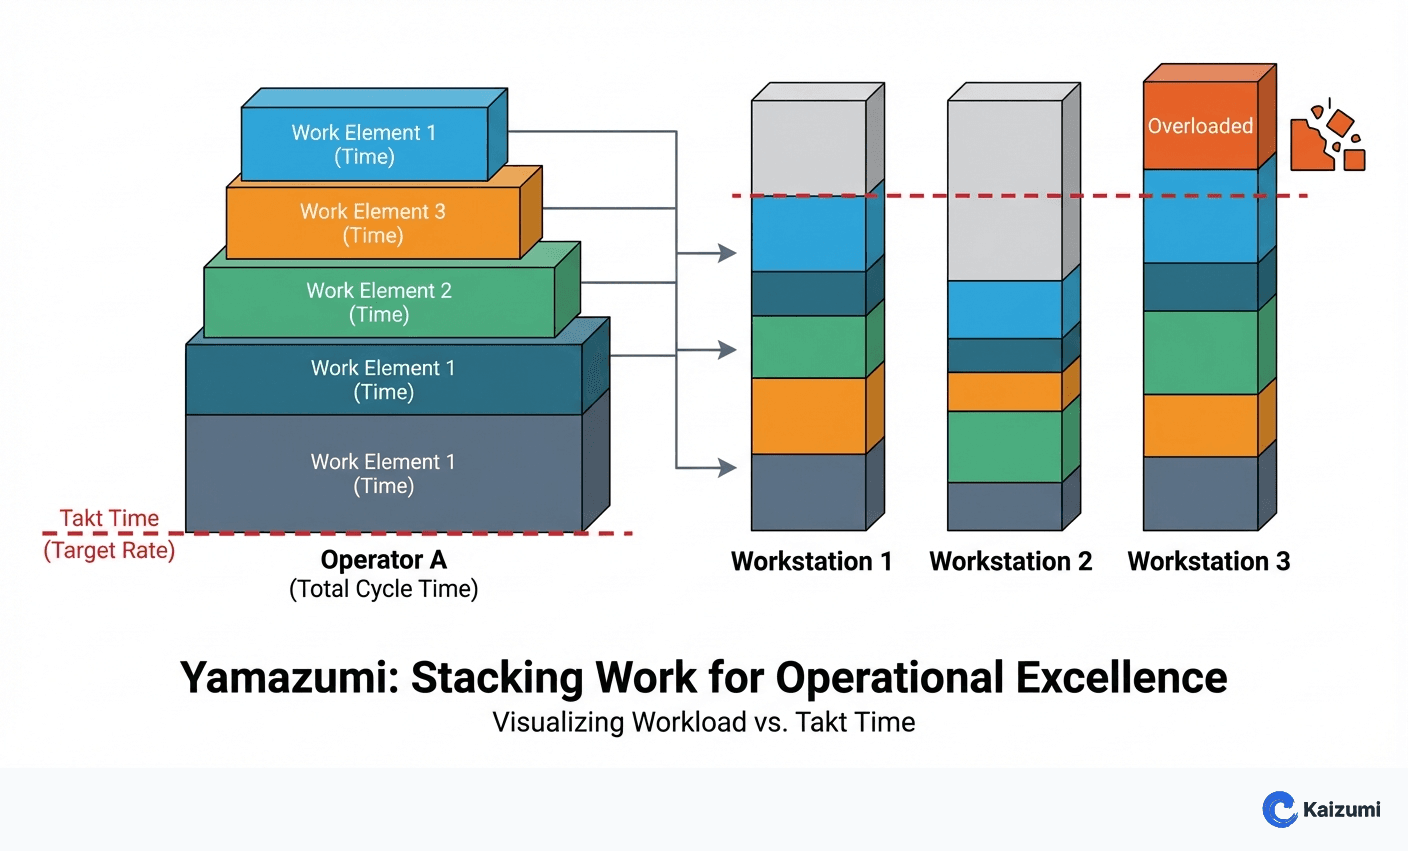
A yamazumi (Japanese for "stacking" or "piling up") is a stacked bar chart that shows the work-element times for each operator or workstation, stacked into a single bar and compared against a horizontal takt time line. Each bar represents one position; each colored segment within a bar represents a single work element and its measured time. Reading the chart is immediate: any bar that rises above the takt line is overburdened and will constrain output, while bars that sit well below the line carry unused capacity. Because it makes work content and balance visible at a glance, the yamazumi (also called an operator balance chart or work-content chart) is the primary tool teams use for line balancing and for building standard work. For a step-by-step, interactive walkthrough — observing cycles, taking the lowest repeatable time, stacking work by zone, and rebalancing the line — see the interactive Yamazumi guide.
How to Read a Yamazumi Chart
The takt line is the reference
Takt time sets the rhythm the line must hold to meet demand. It is drawn as a horizontal line across every bar. The goal of a yamazumi is not to make every bar as short as possible — it is to bring each bar close to, but safely under, takt time so the line produces to demand without overburden.
Bars above the line are bottlenecks
A bar taller than the takt line means that operator cannot finish their work within the available time. That station throttles the entire line's output regardless of how fast the others run. These are the bars you attack first — by moving elements off them, simplifying the work, or eliminating waste inside an element.
Bars far below the line are unused capacity
A bar well under takt time means slack. That capacity is where work from overburdened stations can be redistributed. When several bars sit far below takt, it often signals that the line could run with fewer operators — the theoretical operator count is the total work content divided by takt time.
Segments tell you what to move
Because each bar is built from individual work elements, the chart shows not just *that* a station is overloaded but *which* elements are driving it. Redistribution decisions are made element by element, constrained by precedence (some elements must happen before others) and by which elements can physically move between stations.
Examples
An assembly line yamazumi showed six stations with work times ranging from 42 to 68 seconds against a 55-second takt time. The 68-second station was the bottleneck capping output; two stations sat near 43 seconds with clear slack. By moving two work elements off the bottleneck onto the underloaded stations, the team rebalanced every bar into the 50–54 second band — lifting throughput with no new equipment or headcount.
Key Points
- A yamazumi makes the relationship between work content and takt time visible at a glance — it is a thinking tool, not just a report.
- Bars above takt time are bottlenecks to attack first; bars far below are the capacity you redistribute into.
- Total work content divided by takt time gives the theoretical minimum operator count — the yamazumi is how teams chase that number.
- The chart is only as trustworthy as its time data: balance decisions made on rough or padded element times produce a rough or padded line.
- Yamazumi work is iterative — it is revisited whenever demand (takt), process improvements (cycle times), or product mix change.
Common Misconceptions
Perfect balance at the takt line is the goal. Stacking every bar exactly to takt leaves no margin for normal variation, and the line stalls the first time anything goes wrong. Good practice balances bars safely *below* takt; how far below depends on process stability.
Yamazumi is only for assembly lines. Any process with sequential, measurable work elements can be charted — service desks, clinical workflows, back-office processing, and warehouse picking all balance the same way. The bars are operators or steps; the line is still takt.
A yamazumi is the same as a cycle-time bar chart. Plain cycle times tell you how long each station takes. A yamazumi adds the takt reference and breaks each bar into movable elements, turning a measurement into a redistribution plan.
Try It
Build your own yamazumi right here. Enter available time and demand to get takt, then add operators and stack their work elements as bars — the chart flags every station that runs over takt and estimates the operator count your work content actually needs.
Play It
Balance a line the way a yamazumi teaches: in Line Designer, place each work element across operators, keep everyone under takt, and beat the headcount target — no walking, nobody overburdened.