
The Hour-by-Hour Board
A production board on the wall isn't a scoreboard — it's the front door to problem-solving. Run a real shift, then follow a loss all the way to a countermeasure.
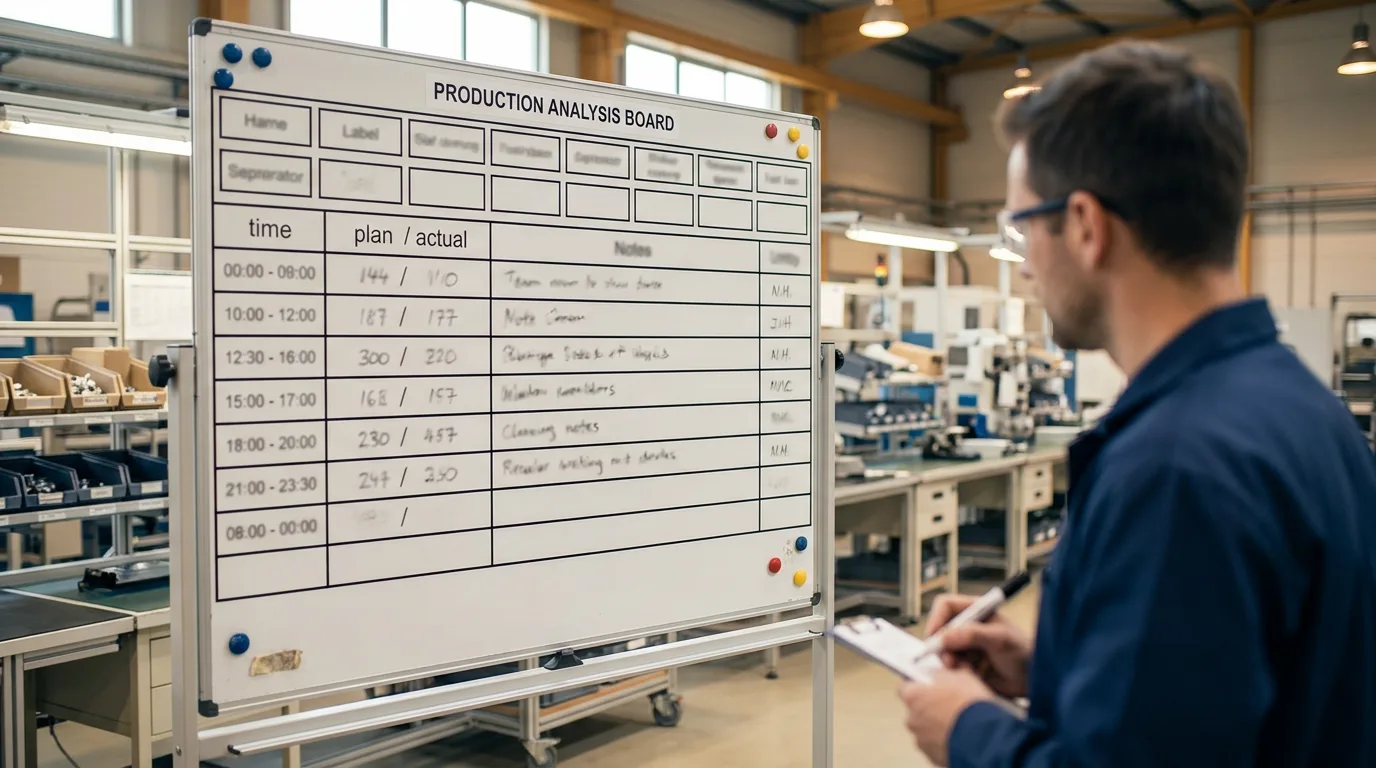
Every hour, a team leader writes two numbers at the line's exit: what we planned to make, and what we actually made. When they don't match, the board's real job kicks in — it decides, in real time, whether this is something you fix in two minutes or something that needs a real investigation.
Press play. Every miss gets a response.
Final Assembly #7: takt 40 seconds, so the plan is 90 units/hour, 690 for the shift. Watch what the team does with each miss — some are fixed on the spot; others can only be contained today and sent upstream to problem-solving.
First — how to read the board · hover a column, or step through
| 1Time | 2Hourly P / A | 3Cumulative P / A | 4Problem → Response | 5Sign-off |
|---|---|---|---|---|
| 06:00–07:00 | 90 / 90 | 90 / 90 | — | Sharon |
| 07:00–08:00 | 90 / 88 | 180 / 178 | Leak-tester timeout | Sharon |
| 09:10–10:10 | 90 / 85 | 360 / 353 | Scratch on front cover | Sharon |
| 12:40–13:40 | 90 / 86 | 630 / 619 | Bent connector pin | Roy |
| 13:50–14:30 | 60 / 60 | 690 / 679 | — | Roy |
Time
One row per hour of the shift. The board fills top-to-bottom as the day runs — so a problem shows up in the hour it happens, not at the end of the day.
| Time | Plan / Actual | Cumulative | Problem → Response |
|---|---|---|---|
| 06:00–07:00 | · / · | · / · | |
| 07:00–08:00 | · / · | · / · | |
| 08:00–09:00 | · / · | · / · | |
| 09:10–10:10 | · / · | · / · | |
| 10:10–11:10 | · / · | · / · | |
| 11:40–12:40 | · / · | · / · | |
| 12:40–13:40 | · / · | · / · | |
| 13:50–14:30 | · / · | · / · |
Cumulative pace — plan vs actual
Loss Pareto — where the units went
A quick fix stops a problem from recurring. A contained one keeps costing you — until it gets solved properly. That's the next step.
Hourly plan/actual is about this hour. The cumulative column is about the shift, and it's unforgiving — lose five units at 9 a.m. and, unless you make them back, you're five short at 2 p.m. The pace line opens up the instant it happens, so the team leader reacts in the same hour, not at the end of the day.
The Pareto decides what earns a real investigation.
One shift's reason codes are noise. Stack a week of them and a signal appears: a few causes account for most of the loss. That top bar is where a quick fix has already failed — it's the one worth a structured root-cause effort. Click the biggest bar to take it into problem-solving.
This week's losses · Final Assembly #7
5 shifts of reason codes, stacked. Click a bar to investigate.
↑ Click “Scratch on front cover”, the tallest bar.
The board is tier 1 of a daily management system
Catch & respond
Record plan/actual. Fix what's quick; contain what isn't and log the cause.
Rank & assign
Review stacked losses. Point the team at the #1 recurring cause.
Root-cause & standardize
Run 5-Whys / A3. Kill the cause, update the standard, watch the bar shrink.
“Just making it visible isn't the objective. Every miss has to link to a countermeasure.”
— Narusawa & Shook, Kaizen Express. The board catches the problem in the hour it happens. The Pareto tells you which one has earned a real fix. The daily cadence makes sure it actually gets one.
Want to run this on your own line? Build your own Hour-by-Hour Board → — enter your takt and actuals, and it computes the plan, the cumulative pace, and the loss Pareto for you.
Frequently asked
- What is an hour-by-hour board?
- An hour-by-hour board (also called a production analysis board) is a display at the exit of a cell or line where a team leader records, every hour, the planned output versus the actual output — both for the hour and cumulatively for the shift — along with the reason for any miss and what was done about it. Its purpose is not to keep score but to surface a problem in the hour it happens, while there is still time to act.
- How do you calculate the hourly production target?
- The hourly target comes from takt time and the available operating time in the hour. If takt is 40 seconds per piece and you have 3,600 working seconds in the hour, the plan is 3,600 ÷ 40 = 90 pieces. Subtract planned breaks from the available time first — a board that plans 90 in an hour that contains a 10-minute break is set up to fail.
- What is the difference between an hour-by-hour board and an andon?
- An andon signals a problem the moment it occurs so someone comes to help immediately — it is a real-time call for assistance. An hour-by-hour board accumulates the record of plan-vs-actual and the reasons across the shift, so patterns become visible and the biggest recurring losses can be prioritized for problem-solving. They are complementary: andon handles the immediate stop; the board turns a week of stops into a Pareto.
- What do you write in the problem / cause column?
- The specific, concrete reason the hour missed — "scratch on front cover", "bent connector pin from supplier", "leak-tester timeout" — not a vague category like "quality" or "downtime". Then note the response: fixed at the line, or contained (sorted, quarantined) and escalated to problem-solving. A cause you can act on is specific; a cause you cannot is just a complaint.
- How does the board connect to problem solving?
- Stack a week of reason codes into a Pareto and the vital few causes stand out. Quick problems get fixed at the line and stop recurring; the recurring ones that a quick fix cannot touch rise to the top of the Pareto and earn a structured investigation — 5 Whys or an A3 — that finds the root cause and changes the standard. The board is tier one of a daily management system: hourly at the board, daily at the Pareto, weekly in problem-solving.