Dashboard
Personalize This
Get insights for your role
A dashboard is a visual display of key metrics and information designed to provide at-a-glance understanding of performance status.
Definition
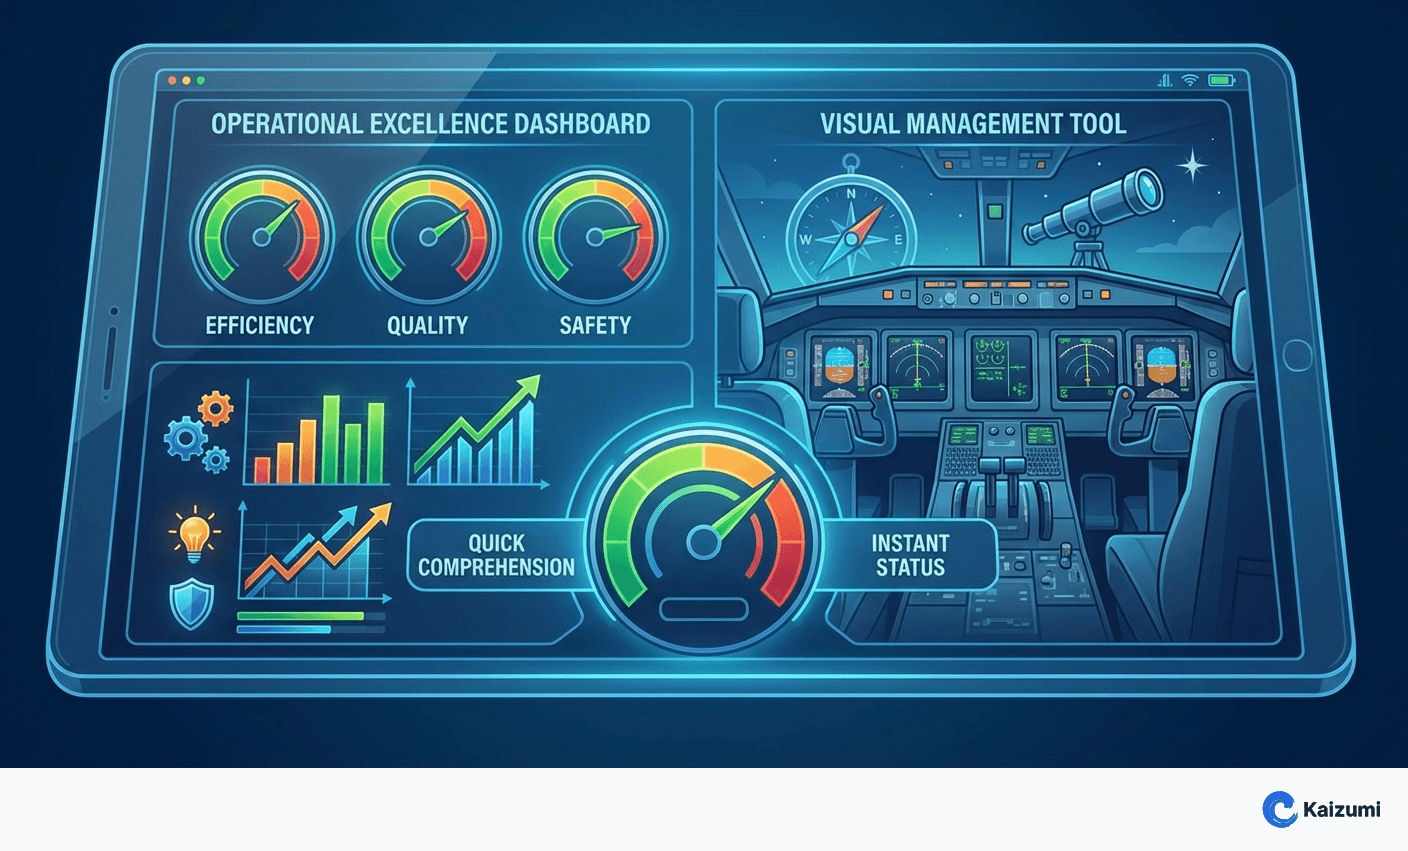
A dashboard is a visual management tool that displays key metrics, indicators, and information in a consolidated view designed for quick comprehension. Effective dashboards show what matters most, use visual encoding (colors, charts, gauges) to communicate status instantly, and enable rapid identification of problems requiring attention. Dashboards range from physical boards in work areas to digital displays updated in real-time—the principle is the same: make performance visible to drive action.
Examples
A production dashboard displays hourly output vs. target, quality metrics, equipment status, and safety incidents. Red/yellow/green indicators show status at a glance. The team reviews it every hour, and problems are visible immediately—no report required.
Key Points
- Consolidates key metrics for at-a-glance understanding
- Visual encoding (color, charts) enables rapid status assessment
- Should drive action, not just display information
- Effective dashboards show the critical few metrics, not everything
Common Misconceptions
More metrics make better dashboards. Cluttered dashboards defeat their purpose. The best dashboards show the critical few metrics that matter most—enough to understand status, few enough to comprehend instantly.
Dashboards replace detailed analysis. Dashboards show status and trigger investigation. When a metric turns red, detailed analysis follows to understand why. Dashboards are early warning systems, not analytical tools.