Production Analysis Board
Personalize This
Get insights for your role
A production analysis board displays real-time production status, targets, and problems to enable rapid response and continuous improvement.
Definition
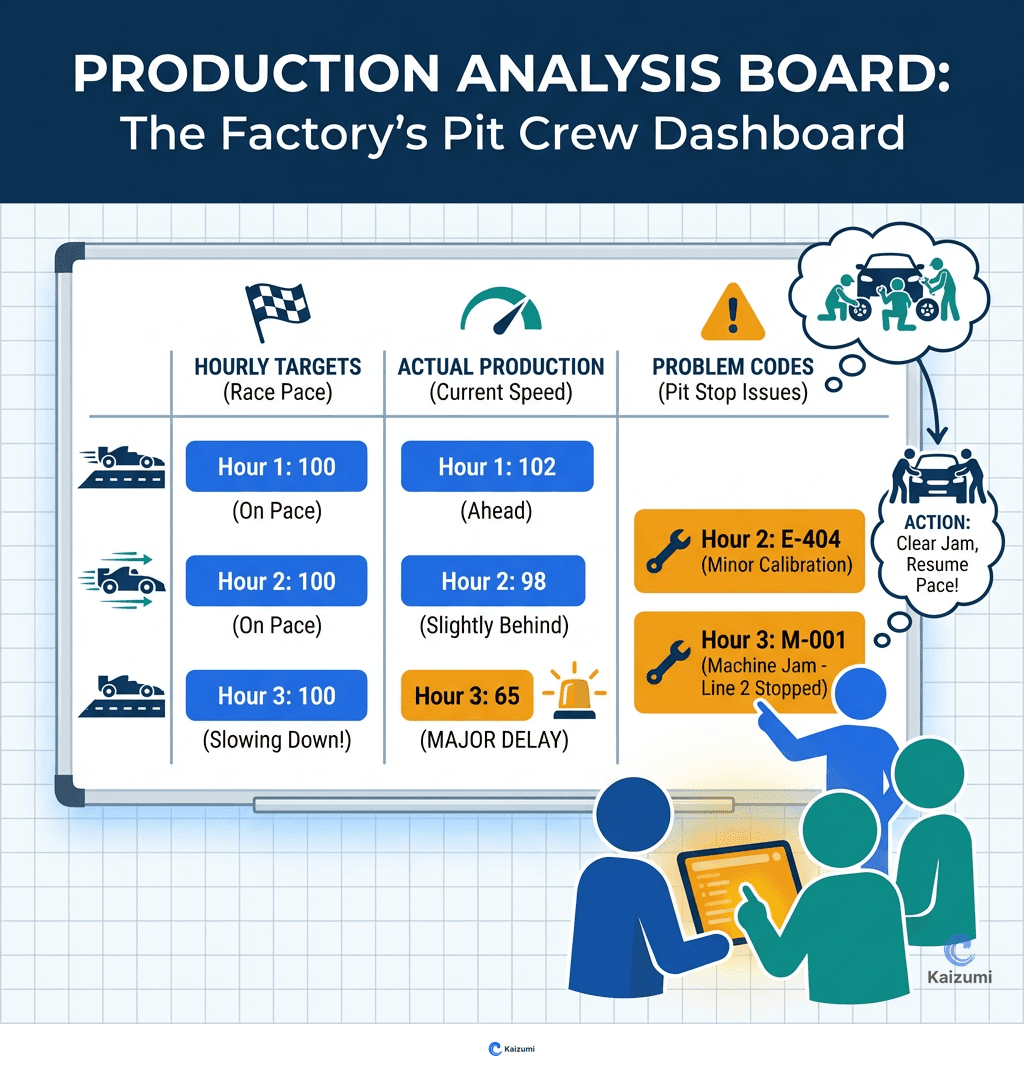
A production analysis board is a visual display that tracks actual production against planned production at regular intervals (hourly, by pitch, or per shift), records reasons for shortfalls, and drives problem-solving. The board makes performance visible to everyone: operators see their status, leaders see where to help, and managers see patterns requiring systemic solutions. Production analysis boards transform performance from an end-of-day surprise into real-time information that enables immediate response. They also create a historical record of problems for root cause analysis and countermeasure tracking.
Examples
An assembly line's production analysis board shows 12 rows (one per hour), with columns for target, actual, difference, and reason codes. At each hour, the team leader updates actual production. If below target, a reason code is entered: M1 (material shortage), E2 (equipment issue), Q3 (quality problem). Leaders respond to current issues; engineers analyze patterns weekly.
Key Points
- Updates must be frequent enough to enable real-time response
- Reason codes should be standardized and limited to enable pattern analysis
- Board review must trigger action—visual without response is just decoration
- Historical data reveals recurring problems requiring systemic solutions
Common Misconceptions
The board is for tracking performance. Tracking is the minimum function. The board's real purpose is driving immediate response to problems and generating data for improvement.
Accurate data matters most. Approximate data that drives action is better than precise data that's too late. A hand-written board updated hourly beats a digital dashboard updated daily.