The shipbuilding gap.
China builds roughly 1,400 large ships a year. America builds five. The Navy’s own slide says the capacity gap is 232-to-1 — but the crown has moved three times before, and every time, it moved to a better production system. A lean history of how nations learn, and forget, to build ships.
The Navy’s own slide says 232×.
A leaked Office of Naval Intelligence briefing puts Chinese shipyard capacity at 23.25 million tons against fewer than 100,000 for the United States — a ratio of 232. Honesty first: the Navy called its own slide "estimates and projections… not a deep-dive," and it measures capacity, not output. So put the slide down and count ships: in 2024, China delivered about 1,400 large merchant vessels. The United States delivered five. That’s not a gap. It’s an absence.
ONI slide via The War Zone (2023), authenticity Navy-confirmed; measured output per Clarksons/CSIS and CRS.One company vs. your industry since 1945.
CSIS ran the comparison that ends arguments: CSSC — China’s state shipbuilder — delivered more commercial tonnage in one year (~14M GT, 250+ ships) than the entire US industry has built since the end of World War II. After 2025’s RMB 115B merger, one CSSC listed company alone holds ~17% of world orders; the group employs about 205,000 people. By Beijing’s own accounting, China took 69% of the world’s new orders in 2025 and holds two-thirds of the global backlog — an all-time high.
CSIS "Ship Wars" (2025); 工信部 three-indicator release (Feb 2026); merger per 信德海事网.The photo that explains the anxiety.
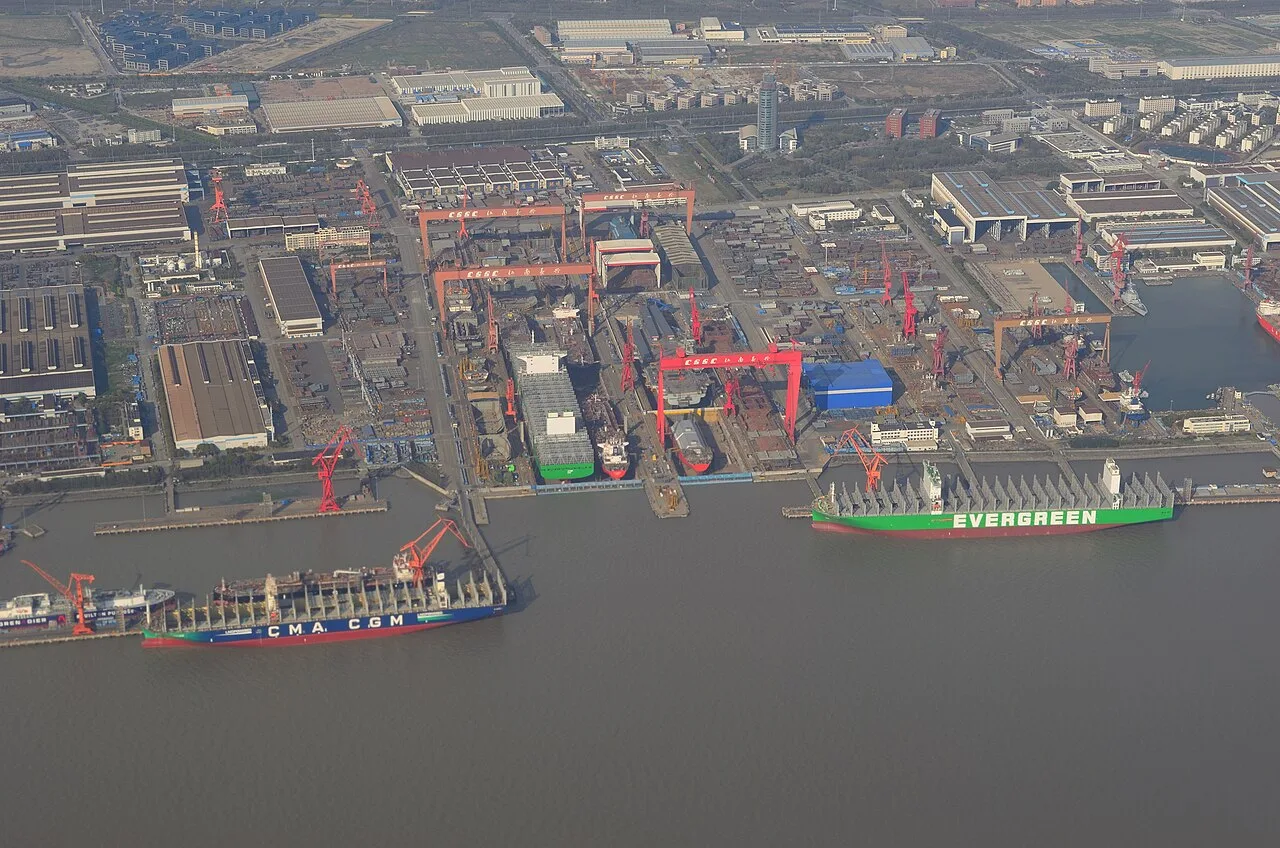
At Jiangnan’s Changxing island base, satellite imagery shows Evergreen container ships moored beside Type 055 cruisers — merchant hulls and warships rising from adjacent lines. In 2024 that one base launched over 80,000 tons of warships while delivering merchant ships on schedule. This is 军民融合 — military-civil fusion — as physical fact: the commercial order book pays for the cranes, the workforce and the steel flow that naval production shares. The US inverse: ~95% of American shipbuilding revenue is naval, with no commercial base underneath it.
CSIS Hidden Reach satellite analysis; the ONI slide for the US revenue split.The crown has moved three times. Watch it.
Shipbuilding supremacy is a relay race with a century-long track. Britain built ~80% of the world’s ships in the 1890s, two-thirds of them on the Clyde. Japan took the crown in 1956 and held half the world for decades. Korea seized it in 2000. China took it in 2010 and now builds more than half of everything afloat. Each handoff looks geopolitical from a distance. Up close, every single one was a production-system transition — and that’s what makes this a lean story.
Transitions on Lloyd’s Register / Clarksons tonnage basis; timeline sources in References.How Britain lost it: a lean parable.
The definitive study (Lorenz, 1991) found nothing wrong with British workers and everything wrong with the system: craft unions held "property rights" to machines and materials — rational insurance against brutal hire-and-fire cycles — which made welding, prefabrication and flow production impossibly conflictual to adopt. The deskilling math they refused: a riveter took six months to train; a welder, two weeks. Between 1947 and 1957, world output grew 300%. Britain’s grew 18%. Locally rational. Globally fatal.
Lorenz, Journal of Economic History (1991); Construction Physics synthesis.America has been the fast one before.
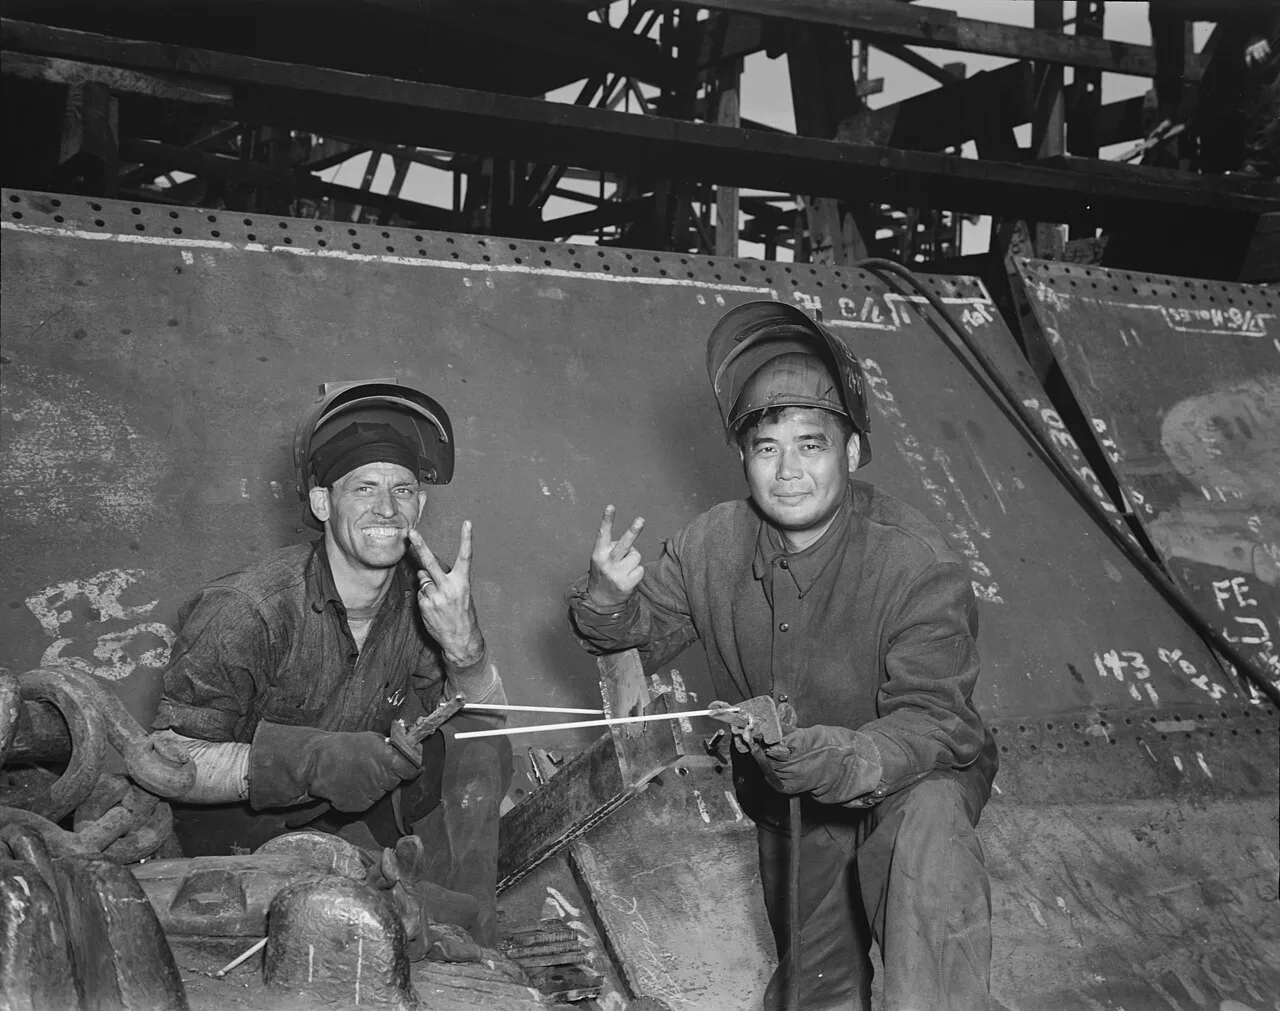
1941–45: the United States built 2,710 Liberty ships, and the average build time fell from 244 days to 42. Kaiser’s yards did it with welding instead of riveting, ~250,000 prefabricated parts per hull, sub-assembly flow, and standardized work so radical that people who had never seen a shipyard — by mid-1944, 41% of Richmond’s welders were women — built the world’s largest merchant fleet. The famous stunt: SS Robert E. Peary, keel to launch in 4 days, 15 hours. Economists measured ~40% annual productivity growth. It’s the canonical learning curve.
Rapping, REStat (1965); MARAD; Kaiser yard histories.The asterisk every lean reader should know.
Sixty years later, Peter Thompson reopened the archives and found two corrections. First: yard capital tripled during the runs — include it, and the learning-by-doing estimate falls by half. Second, and more important for us: part of the speed was bought with quality — hull fractures affected over 60% of ships from the worst yard. Speed without built-in quality is rework at sea. And when flow broke, yards forgot at 3–5% per month. The Liberty program is the learning curve and its cautionary twin, measured honestly.
Thompson, JPE (2001) and Management Science (2007).Then America switched it off.
Postwar commercial shipbuilding lived on the Construction Differential Subsidy — up to half the US-vs-foreign cost gap, paid since 1936. In 1981 the Reagan administration ended it unilaterally, while every rival kept subsidizing. Orders went 69 → 0 in eight years. What remained became a one-customer Navy industry at 4–5× world prices — and the cause isn’t wages (US ~$18/hr vs Korea ~$16 in 2010; labor is ~$10M on a $200M ship). It’s batch-of-one production: the 2005 benchmarking study measured US yards at 30–90 man-hours/CGT, low pre-outfitting, +10–15% naval paperwork overhead — and told them, verbatim, to "become more lean."
CDS history per Marine Log/NPS; FMI Global Shipbuilding Benchmarking (ODUSD, 2005); CRS price multiples.Who actually invented fast shipbuilding? Japan.
Modern shipbuilding — block construction, zone outfitting, welding-first design, statistical process control — was invented in post-war Japan, the maritime sibling of the Toyota Production System, stabilized by government "Planned Shipbuilding" demand. Korea industrialized it at chaebol scale in the 1990s. China financed it: economists measured ~$91B in hidden subsidies in 2006–13 alone — with a verdict lean readers will enjoy: 69% went to entry subsidies that spawned inefficient yards, and the welfare returns were poor. Capacity is not capability.
Barwick, Kalouptsidi & Zahur, Review of Economic Studies (2024) and JEP (2024); OECD subsidy accounting in References.But watch China learn, not just scale.
The sharpest counter-evidence to "it’s only subsidies" is a learning curve with dates on it. Hudong-Zhonghua’s 174,000 m³ LNG carriers — the hardest merchant ship there is — came off the line 76 days faster on ship #2, 20 more on #3, 34 more on #4, down to a 16-month build record in December 2025 against Korea’s historic 18–24. Four LNG deliveries in one month. The named mechanisms: digital shipbuilding and a shift from serial (串联式) to parallel (并联式) production — overlapping problem-solving, at yard scale, in the segment Japan and Korea monopolized five years ago.
上海证券报, 上观新闻, CCTV via 福建省工信厅 — full links in Sources.Ask the two countries who wore the crown.
Japan fell from half the world to ~13% — with policy fingerprints: two government-mandated capacity cuts halved its equipment and cut personnel to a third, then the Plaza Accord finished the job. Nikkei’s 2025 mood: 「造船が滅べば国も滅ぶ」 — "if shipbuilding dies, the nation dies." Korea holds ~20% by choice — selective, high-value orders (19 of 2025’s LNG carriers) — but is short ~30,000 workers, with 80% of new hires foreign. Neither reads its position as stable. Both are now exporting the one thing China can’t order from a catalog: the production system itself.
MLIT 造船業再生ロードマップ (Dec 2025); Korea Herald labor-crisis reporting.Philadelphia, 2026: the NUMMI of shipbuilding.
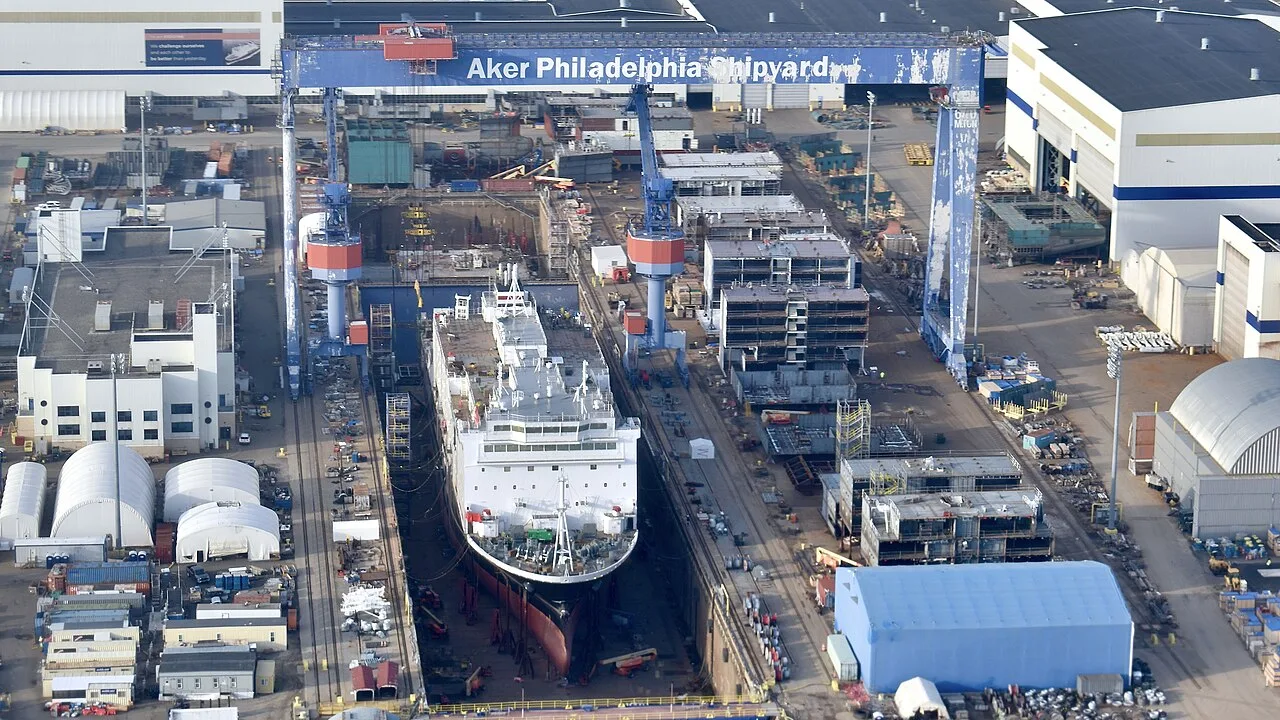
In December 2024 Hanwha bought Philly Shipyard — America’s ~1.5-ships-a-year Jones Act workhorse — for $100M. Then came the $5B expansion under Korea’s $150B MASGA package: two more docks, a target of up to 20 ships a year, and the part that matters most: Philadelphia workers training inside Hanwha’s Geoje yard, the first builder ever to deliver 200 LNG carriers. Foreign flow production arriving at a struggling American plant, workforce retrained in the donor’s system — lean readers have seen this film. In 1984 it was called NUMMI. Beijing noticed too: it sanctioned five Hanwha US subsidiaries within a year.
Hanwha press & feature stories; The Diplomat on MASGA; 商务部 countermeasures (Oct 2025).The policy scoreboard, honestly kept.
Port fees on Chinese-built ships were implemented in October 2025 — and suspended a month later in the trade truce. While they loomed, China’s monthly order share dipped below 30%; once shipowners adjusted, it rebounded to 84%. The SHIPS Act is still in committee. The Maritime Action Plan proposes fees and workforce pipelines. Meanwhile the Navy’s own clock runs backward: destroyers and submarines that took 5–6 years in the 2000s now take 9–10, and Virginia-class boats run at ~1.2 a year against 2.0 funded. Demand signals are accumulating. Capability is the bottleneck — and capability is a production system.
USTR/Holland & Knight; CSIS order-share tracking; CBO/CRS build rates.The lesson the crown keeps teaching.
Riveted craft lost to welded flow. Flow lost to blocks and zone outfitting. Method scaled by finance took the crown last. Through every transition, the constants are the ones lean practitioners already know: capacity is not capability; demand stability is the substrate of learning; forgetting runs at 3–5% a month when flow breaks. The most interesting experiment in Western manufacturing right now is an hour’s drive from half of America: whether flow shipbuilding can be transplanted to Philadelphia faster than it was forgotten. Go see.
Companions: The 18-Month Car · Parts Per Billion.After the 2025 listed-entity merger (RMB 115B — the largest restructuring in A-share history), one CSSC company holds ~16.8% of global new orders; the parent group employs ~205,000 people.
One frame, two fleets: At Jiangnan’s Changxing base, satellite imagery shows Evergreen container ships moored beside Type 055 cruisers; the yard launched over 80,000 tons of warships in 2024 while building merchant hulls on adjacent lines.
The same ONI slide: ~95% of US shipbuilding revenue is naval — there is almost no commercial base to surge from. China’s yards run both, and each side subsidizes the other.
The deskilling math Britain refused: a riveter took ~6 months to qualify; a wartime welder, ~2 weeks. While world output rose 300% (1947–57), British output rose 18%.
2,710 Liberty ships, 1941–45, at 18 emergency yards; ~250,000 prefabricated parts per ship, welded not riveted. Kaiser’s yards supplied ~27% of Maritime Commission output with workers who had never seen a shipyard — prefabrication, sub-assembly flow, and standardized work deskilled the trade. By mid-1944, 41% of welders at Richmond were women.
Rapping (1965): man-hours per hull fell 55% in three years — ~40% annual productivity growth, the canonical learning-by-doing case. SS Robert E. Peary: keel to launch in 4 days, 15 hours — a staged publicity stunt with pre-staged components, and still the flag on the curve.
Thompson (JPE 2001), with new archive data: yard capital roughly tripled over the runs — including it cuts the estimated learning-by-doing contribution about in half.
The lean reading: the Liberty program is jidoka’s cautionary twin — flow and standard work without quality-at-the-source, measured honestly sixty years later.
It is not a wage story: in 2010, US shipyard labor ran ~$18/hr vs Korea’s ~$16 — and on a $200M ship, yard labor is roughly $10M. The gap is batch-of-one production: a yard building 2 ships a year has no learning curve against one building 20.
The sharpest evidence China is now learning, not just scaling: Hudong-Zhonghua’s documented LNG-carrier learning curve — each successive ship faster, down to a 16-month build (Korea’s historic benchmark: ~18–24 months).
Four LNG carriers delivered in a single month; ~60 LNG orders in backlog (>20% of the world); 19 hulls under construction at once — a market Japan and Korea monopolized five years ago.
The method transfer is explicit: Philadelphia workers train at Hanwha Ocean’s Geoje yard (first builder ever to deliver 200 LNG carriers); robotic welding, block construction, digital-twin smart-yard practice transplanted whole. Aug 2025: 10 product tankers ordered — the largest US commercial shipbuilding order in over 20 years.
HD Hyundai runs the parallel track: joint LNG dual-fuel containerships at Tampa Ship, and a first-ever Korean partnership on US naval construction with Huntington Ingalls.

The crown follows the production system.
Britain had the ships, Japan had the method, Korea had the scale, China has the finance — and the most instructive experiment of the decade is whether the method can be transplanted back. The mechanisms underneath are the ones you already practice: flow, standard work, learning curves, and the cost of breaking them.
The 18-Month Car
The same speed story on wheels — how Chinese automakers halved development.
kaizumi.com/guides/the-18-month-carParts Per Billion
Inside CATL’s extreme manufacturing — with a battery cell you can take apart.
kaizumi.com/guides/parts-per-billionBatch vs. flow
Why speed comes from flow, not hustle — the physics Liberty yards proved.
kaizumi.com/guides/batch-vs-flowTrain your team
AI-built lean training for your industry, your roles, your reality.
kaizumi.comFrequently asked
- Is China’s shipbuilding capacity really 232 times America’s?
- The figure comes from a leaked US Office of Naval Intelligence briefing slide (2023, authenticity confirmed by the Navy): Chinese shipyard capacity ~23.25 million tons versus under 100,000 tons for the US. The Navy itself called the slide "estimates and projections… not a deep-dive," and it measures capacity with undisclosed methodology. The measured numbers are nearly as stark: in 2024 China delivered ~1,400 large merchant ships (~57% of world tonnage) while the US delivered 5 (~0.1%), and in 2025 China took 69% of world new orders on China’s own MIIT accounting.
- Why are US-built ships 4–5 times more expensive?
- Not wages — US shipyard labor ran ~$18/hr versus Korea’s ~$16 in 2010, and labor is roughly $10M on a $200M ship. The drivers are batch-of-one production and scale: a yard building 2 ships a year has no learning curve or purchasing power against one building 20. The 2005 First Marine International benchmark measured US yards at 30–90 man-hours per CGT with low module building and pre-outfitting, high first-of-class drop-off, and a +10–15% naval "customer factor" of administrative work content — and literally recommended that US yards "become more lean."
- What actually happened to American shipbuilding?
- It was switched off, not out-competed on the factory floor. US commercial shipbuilding lived on the Construction Differential Subsidy (up to 50% of the US-foreign cost gap, paid since 1936). The Reagan administration terminated it in 1981 while every rival kept subsidizing; large commercial vessels on order at US yards went from 69 in 1980 to zero in 1988, and the industry became a one-customer Navy business — about 95% of US shipbuilding revenue is naval today.
- What were the Liberty ships, and what did they prove?
- America’s WWII emergency fleet: 2,710 standardized cargo ships whose average build time fell from 244 days to 42 through welding (a welder trained in ~2 weeks versus ~6 months for a riveter), massive prefabrication, and standardized work — the canonical industrial learning curve (~40%/year productivity growth per Rapping). The honest asterisk, from Thompson’s archival work: yard capital tripled (halving the learning estimate) and some speed was bought with quality — hull fractures affected over 60% of ships at the worst yard — while idle yards forgot at 3–5% per month.
- Is China’s dominance just subsidies?
- Subsidies are enormous but not the whole story. Economists measured ~$91B of hidden support in 2006–13 alone (Barwick, Kalouptsidi & Zahur, Review of Economic Studies 2024) — and found poor welfare returns, since 69% went to entry subsidies that spawned inefficient yards. The counter-evidence that China is now learning, not just scaling: Hudong-Zhonghua’s documented LNG-carrier learning curve — each successive ship dramatically faster, down to a 16-month build record in Dec 2025 against Korea’s historic 18–24 months — driven by digital shipbuilding and parallel (并联式) production.
- What is happening at Philly Shipyard?
- The most interesting production-system transplant since NUMMI. Hanwha (Korea) bought Philly Shipyard for $100M in December 2024, then announced a $5B expansion under Korea’s $150B MASGA package — two more docks and a target of up to 20 ships a year, versus the yard’s historic ~1.5. Philadelphia workers train inside Hanwha Ocean’s Geoje yard (the first builder to deliver 200 LNG carriers), and the yard booked 10 product tankers in 2025 — the largest US commercial order in over 20 years. China responded by sanctioning five Hanwha US subsidiaries.
- Did the US port fees on Chinese ships work?
- Briefly, then no. The Section 301 fees took effect October 14, 2025; while they loomed, China’s monthly share of world new orders fell below 30% (March–May 2025). Owners adjusted, the share rebounded to 84% by late summer, and the fees were suspended in November 2025 as part of the US–China trade truce. Full-year 2025: China’s order share fell from 70% to 63%, with Korea the main beneficiary.
Founder of Kaizumi, an AI-powered Lean training platform. More about Matthew →
Updated July 12, 2026 · Drafted with AI assistance and reviewed by Matthew Savas for accuracy. Every statistic is dated and sourced (data as of 2026-07-11). The 232× figure is presented as what it is — an ONI capacity estimate with the Navy’s own caveats attached — and advocacy numbers are labeled throughout. The hero image is AI-generated.
References
Every statistic in this guide traces to one of the sources below · data as of 2026-07-11. Chinese and Japanese titles are given as published.
The gap, measured
- The War Zone — the leaked ONI 232× slide, with the Navy’s own caveats (Jul 2023)
- CSIS, "Ship Wars: Confronting China’s Dual-Use Shipbuilding Empire" (Mar 2025) — CSSC vs US-since-WWII; 307 yards
- CSIS Hidden Reach — Evergreen hulls beside Type 055s at Jiangnan (satellite imagery)
- 工信部 via 新浪财经 — 2025 three indicators: 56.1% / 69.0% / 66.8% (Feb 2026)
- CRS IF12534 — US commercial shipbuilding in global context (≤5 ships/yr vs 1,000+)
- 信德海事网 — the CSSC–CSIC merger: world’s largest shipbuilding group (Aug 2025)
The crown (history & academics)
- Lorenz, "An Evolutionary Explanation for Competitive Decline: British Shipbuilding 1890–1970" (JEH, 1991)
- Construction Physics — How the UK lost its shipbuilding industry
- Construction Physics — How Japan invented modern shipbuilding
- Construction Physics — How China became the world’s biggest shipbuilder
- 国土交通省海事局 — 造船業の現状と課題 (Japan’s own account of its rise, capacity cuts, and fall)
- USNI Proceedings, "Japan’s Phenomenal Shipbuilders" (1966) — the 1956 transition as it looked then
Liberty ships & the learning curve
- Rapping, "Learning and World War II Production Functions" (REStat, 1965)
- Thompson, "How Much Did the Liberty Shipbuilders Learn?" (JPE, 2001) — capital and quality corrections
- Thompson, "How Much Did the Liberty Shipbuilders Forget?" (Mgmt Science, 2007) — 3–5%/month forgetting
- MARAD — the Emergency Shipbuilding Program
- Kaiser Permanente history — the Richmond shipyard workforce ("Wendy the Welder")
- Hudson Institute (Herman) — Closing the shipbuilding gap: lessons from Henry Kaiser
Why US prices are 4–5×
- First Marine International benchmarking study (ODUSD, 2005) — man-hours/CGT; "become more lean"
- CRS R45725 — US-built tanker ~4×, container ship ~5× world price
- RAND — Why Has the Cost of Navy Ships Risen? (2006)
- USNI Proceedings — The high costs of doing (shipbuilding) business (Feb 2025)
- Marine Log — the 1981 CDS termination and the collapse from 69 orders to 0
China’s method & subsidies
- Barwick, Kalouptsidi & Zahur — Industrial Policy Implementation: China’s shipbuilding (ReStud, 2024) — $91B hidden subsidies
- Barwick, Kalouptsidi & Zahur — Industrial Policy: Lessons from Shipbuilding (JEP, 2024)
- OECD (2026) — $21.3B of $25.6B measured shipbuilding subsidies 2010–24 went to Chinese firms
- 上海证券报 — Hudong-Zhonghua: 4 LNG carriers delivered in one month; record build cycles
- 福建省工信厅/CCTV — 解码造船业"中国速度": serial → parallel production
The transplant & the scoreboard
- Hanwha — $5B Philly Shipyard investment; 20-ships/yr target under MASGA
- Hanwha — how Philly Shipyard plans to anchor America’s next shipbuilding boom (Geoje training)
- The Diplomat — how MASGA could reshape US shipbuilding (Aug 2025)
- CSIS — Are US policies eroding China’s dominance in shipbuilding? (Sept 2025)
- Holland & Knight — USTR port-fee suspension explainer (Nov 2025)
- CBO — Navy shipbuilding plan analysis; destroyer/sub build times 5–6 → 9–10 years
- Korea Herald — Korea’s shipyard labor crisis: 14.7% vacancy, foreign-worker dependence
- 商务部 — China’s reciprocal port fees and Hanwha Ocean countermeasures (Oct 2025)