
OEE — Overall Equipment Effectiveness — is one number that tells you how much of your equipment's useful capacity you actually got: Availability × Performance × Quality. The arithmetic is trivial. The hard part is using it: defining planned time honestly, capturing real stops on the floor instead of trusting the line's own counter, and reading the three factors as a map to the specific lost minutes you can go fix. This guide walks all of that for a manufacturing line — with the three numbers translated for the floor, a worked example, a quick health check, and the failure modes that quietly turn OEE into a poster nobody believes. You'll finish able to calculate and defend an OEE for one line this week.
Why OEE is different in manufacturing
OEE gets taught as a tidy multiplication — three percentages, multiply, done. On the floor, the number isn't the work; deciding what goes into it is. Three things make manufacturing the place where OEE either earns its keep or becomes a dashboard tile everyone ignores:
- "Planned time" is a decision, not a clock reading. OEE is measured against the time you planned to run. Breaks, no-demand periods, and scheduled maintenance come out first — they aren't failures, so counting them as downtime punishes the line for things it did right. Measure against the full 24 hours and your OEE is a fantasy; measure against honest planned time and it points at real losses. This is the same honesty takt time demands of available time.
- One number hides three very different problems. A line at 60% OEE could be down half the shift (Availability), crawling at reduced speed (Performance), or scrapping a third of what it makes (Quality) — and the fix for each is completely different. The headline percentage is useless until you split it.
- The line lies, gently. A control system logs the big breakdowns but rounds away the minor stops — the ten-second jams, the misfeeds, the "I nudged it and it kept going." Those small losses are often the single biggest chunk of lost Performance, and they only show up if someone watches the line at the gemba, stopwatch in hand, rather than trusting the counter.
- A high OEE on the wrong thing is still waste. Maxing OEE on a non-bottleneck machine just builds inventory faster — overproduction, the waste that hides problems and ties up cash. OEE earns its keep on the constraint, not on every asset with a sensor.
So the goal isn't a bigger number on a screen. Borrowing the Toyota lens: efficiency is the consequence, not the goal. You're chasing the specific lost minutes behind the number — the breakdown, the slow changeover, the startup scrap — because removing those is what makes the work flow.
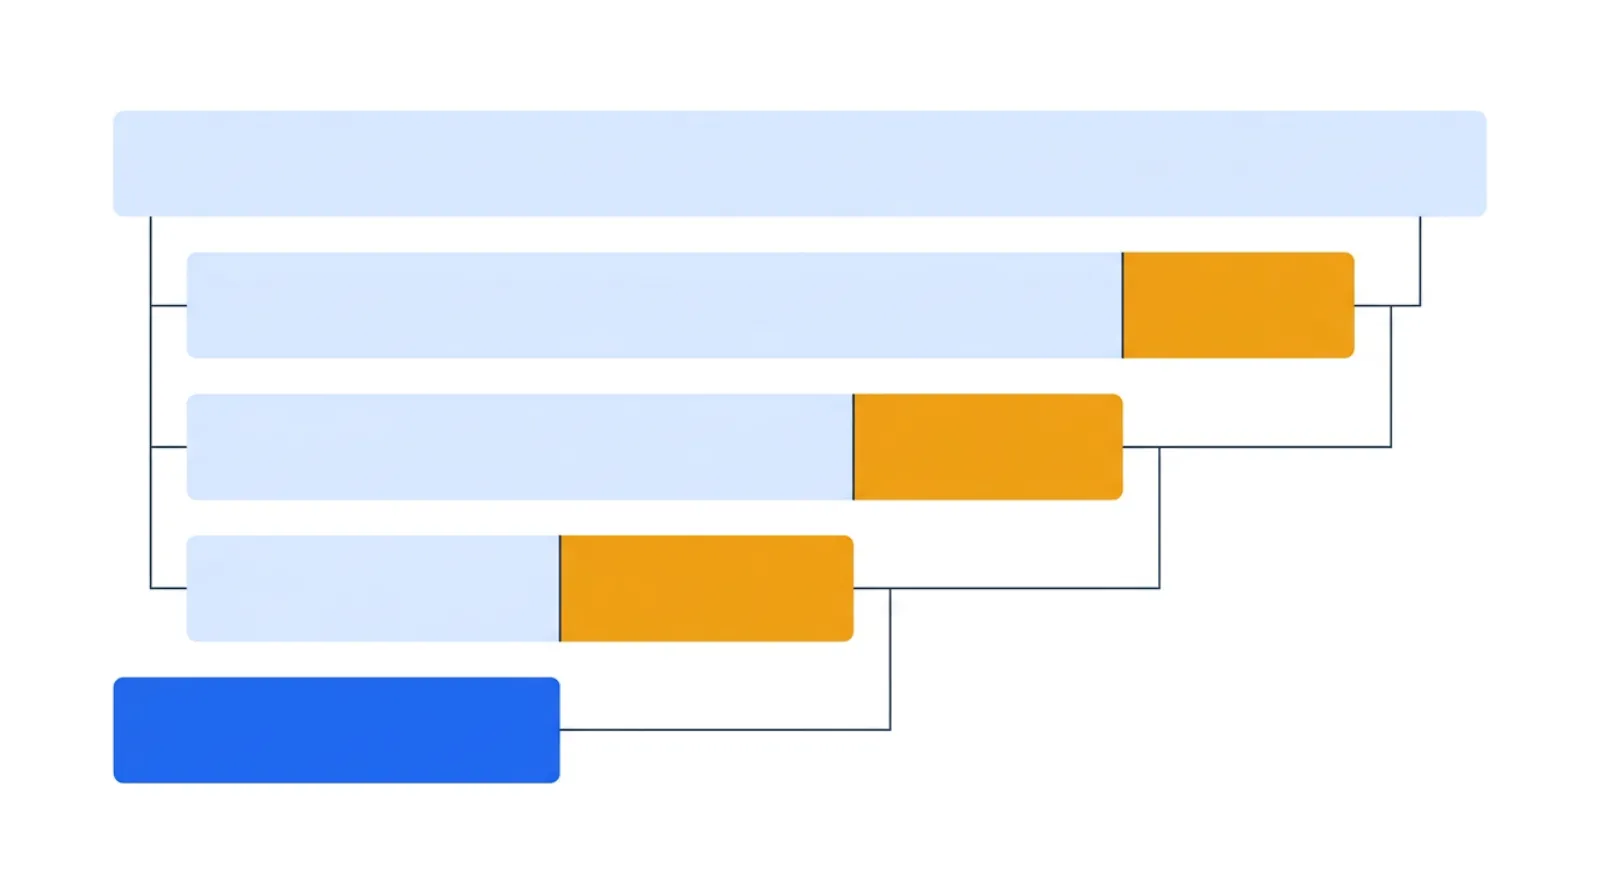 Each loss carves a slice off the shift; OEE is the blue sliver that survives.
The one-line test for any OEE number: can you name the specific lost minutes behind it? If the percentage moves but you can't point to what changed on the floor, you're measuring, not improving.
The three numbers behind OEE
OEE multiplies three factors, each a percentage from 0–100%: OEE = Availability × Performance × Quality. The multiplication matters — three "pretty good" 90% factors compound to a 73% OEE, which is why world-class is around 85% and not 95%. Here's what each factor actually means once there's a real machine involved.
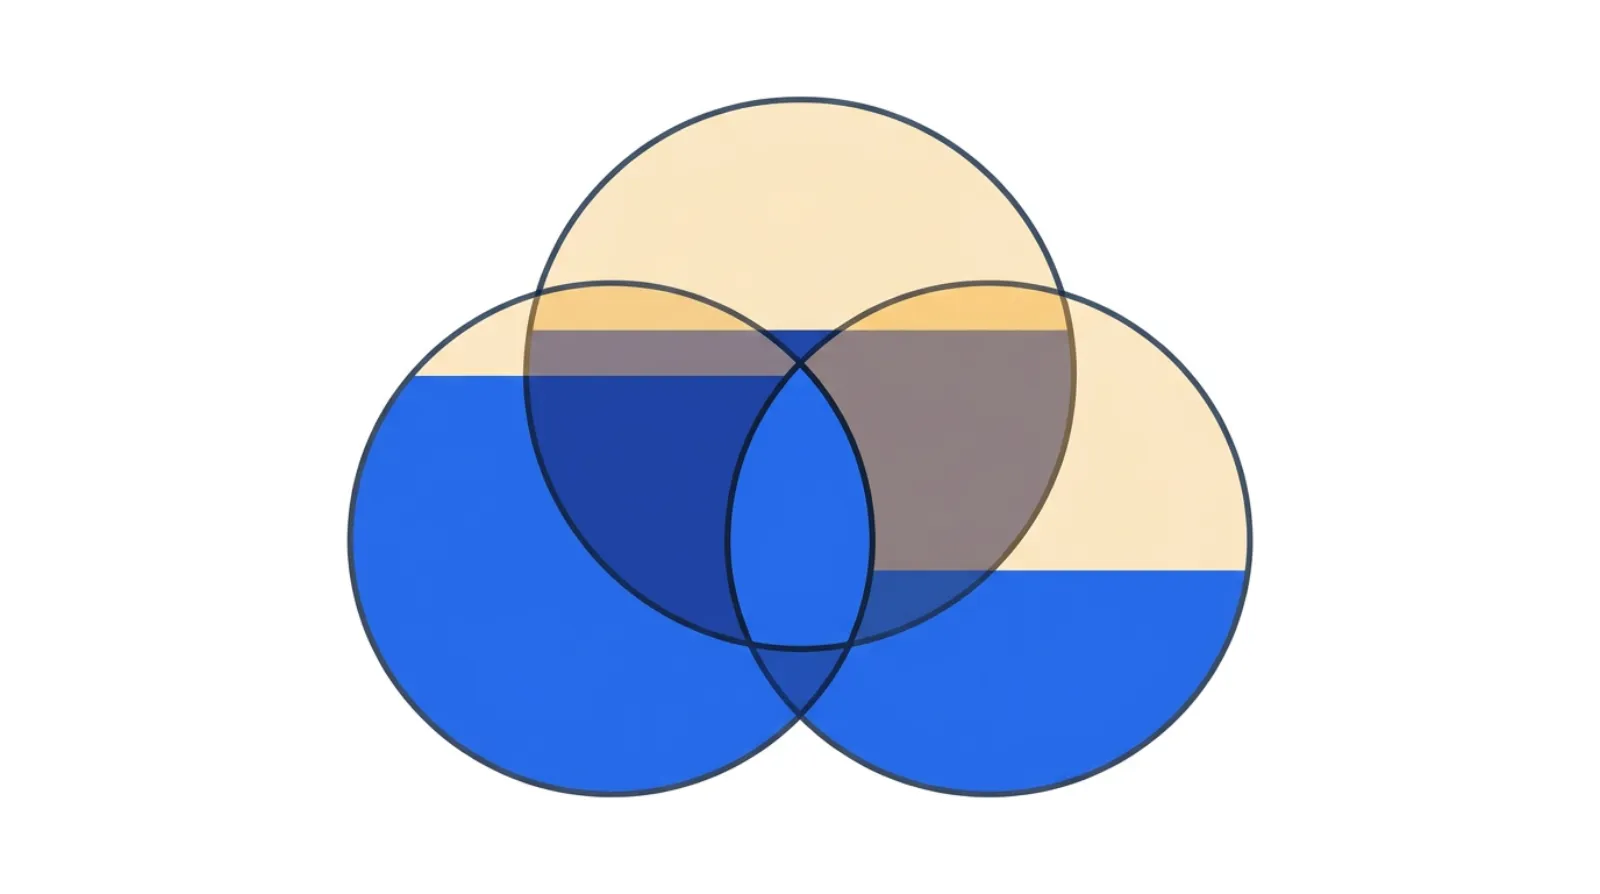 Three good-looking factors multiply down — the combined result is always smaller than any single one.
1Availability — Availability: was the machine running when it was supposed to?
Availability is run time ÷ planned production time. It answers a single question: of the time you meant to be making product, how much were you actually making it?
- Start from planned production time — the shift minus the losses you already know about and accept: breaks, no scheduled demand, planned maintenance. Don't pad it and don't count it against the line.
- What's left to subtract is unplanned downtime: breakdowns and changeovers. These are the first of the six big losses, and on most lines changeover time is the fattest, most controllable target — it's why setup reduction (SMED) so often follows an OEE study.
- Watch the trap: a line "available" 95% of the time but down for a 40-minute changeover every two hours has an Availability problem disguised as a scheduling one.
2Performance — speed loss and minor stops: was it running as fast as it should?
Performance is (ideal cycle time × total count) ÷ run time. It answers: while the machine was running, did it run at its rated speed?
- Two losses live here: reduced speed (the line dialed down because it jams at full rate, or because nobody reset it after a problem) and idling and minor stops — the brief, uncounted hiccups that a logbook never captures.
- Minor stops are the quiet OEE killer. Each one is trivial; together they can erase 10–15 points. The honest cycle-time you measure at the gemba almost never matches the engineered standard, and the gap is your Performance loss.
- Be honest about ideal cycle time — use the design rate the equipment can genuinely sustain, not an inflated number that makes Performance look bad, and not a sandbagged one that hides real speed loss.
3Quality — good parts, the first time: first-pass yield
Quality is good count ÷ total count. Only parts that come off right the first time count — reworked parts are not good parts, they're rework wearing a disguise.
- The losses here are defects/rework in steady state and startup rejects — the scrap a line throws while it stabilizes after a stop or changeover. Startup loss is why a line that stops often has a hidden Quality problem on top of its Availability one.
- Counting reworked parts as good is the most common way teams flatter their OEE. If an operator touched it twice, it failed the first time — that's the number that tells you where to build quality in at the source (jidoka), instead of inspecting it in later.
How to calculate your first OEE (step-by-step)
Don't instrument the whole plant. Pick one line — ideally your constraint — and measure one shift well.
- Set honest planned production time. Take the shift length and subtract only the losses you plan and accept: breaks, no-demand, scheduled maintenance. This is your denominator. Write down what you subtracted so you can defend it.
- Log run time and downtime. Track every stop and its reason — breakdown, changeover, material-out, minor stop. Run Time = Planned Time − all downtime. Availability = Run Time ÷ Planned Production Time.
- Capture ideal cycle time and total count. Use the genuine rated speed. Performance = (Ideal Cycle Time × Total Count) ÷ Run Time. If this comes out above 100%, your ideal cycle time is wrong (or you missed downtime) — fix the input, don't cap the number.
- Count good parts. Good Count = total minus scrap and rework. Quality = Good Count ÷ Total Count.
- Multiply. OEE = Availability × Performance × Quality. Now you have the headline number — and, more importantly, three factors.
- Read the factors, not the headline. The lowest factor is your starting point. Categorize its losses against the six big losses, pick the single biggest one, and run one improvement at it. Re-measure. That loop — not the dashboard — is where OEE pays off.
A worked example: one packaging line
To make the three factors concrete, here's how they'd play out on a single packaging line over one shift. The numbers are an honest hypothetical — the moves are the ones you'd actually make.
Say a line ran an 8-hour shift with 45 minutes of breaks and planned stops, leaving 435 minutes of planned production time. A walk and a clean stop log turn up the picture below:
| Factor | This line | What's dragging it down |
|---|---|---|
| Availability | 88% | One unplanned breakdown plus a long manual changeover ate ~52 minutes |
| Performance | 92% | Minor stops at the labeler; the line was run ~5% under its rated speed |
| Quality | 99% | A handful of startup rejects thrown after each changeover |
| OEE | ~80% | Changeover shows up twice — in downtime and in startup scrap |
OEE here is 0.88 × 0.92 × 0.99 ≈ 80%. The headline (80%, not bad) is the least useful thing on the table. The useful thing is that changeover is hitting two factors at once — it steals run time and it generates the startup scrap. That makes it the obvious first target: cut changeover time and stabilize the restart, and both Availability and Quality move together. You don't get there by staring at "80%"; you get there by splitting it. The gain comes from removing specific lost minutes, not from asking the line to try harder.
Run your own line — enter planned time, downtime, speed, and counts, and the calculator splits Availability, Performance, and Quality for you:
A simple OEE health check
Before you trust an OEE number — yours or a vendor's dashboard's — walk it against these five questions:
- Honest denominator? Is planned production time the time you genuinely meant to run, with planned stops removed and nothing padded?
- Real stops, real reasons? Are downtime events captured with causes at the gemba, including the minor stops the counter rounds away?
- Truthful ideal cycle time? Is Performance built on the rate the equipment can actually sustain — and never above 100%?
- Good means good? Does Quality count only first-pass-good parts, with rework excluded?
- Does it drive one action? Can you name the single biggest loss and the one improvement you're running at it — or is the number just being reported?
You can run the math (and keep the three factors split) with the free OEE calculator — no spreadsheet wrangling, no login.
Common manufacturing OEE mistakes
- Reporting the headline, hiding the factors. "We're at 78%" tells you nothing actionable. Always split it — the lowest factor is the whole point.
- A dishonest denominator. Measuring against the full clock (punishing the line for breaks and no-demand) or padding planned downtime to flatter the number. Either way the OEE is fiction.
- Counting rework as good. The fastest way to a pretty Quality factor and a hidden defect problem. If it was touched twice, it failed once.
- Trusting the line over the gemba. Control systems log breakdowns and round away minor stops — often the biggest Performance loss. Watch the line; don't just read its counter.
- Chasing OEE on the wrong asset. Maxing a non-bottleneck just builds inventory faster. Improve OEE on the constraint; elsewhere it's motion without flow.
- OEE as a scoreboard, not a compass. Posting the number to rank shifts breeds gaming and fear. Used right — done with the team, pointed at losses — it's a map to the next fix, not a stick.
Templates & tools
- Free OEE calculator — enter planned time, downtime, counts, and rejects; get Availability, Performance, Quality, and OEE split out. No login required.
- Related: Total Productive Maintenance for attacking the breakdown and minor-stop losses, and Kaizen for running the improvement an OEE study surfaces.
FAQ
What is a good OEE score in manufacturing? World-class is generally cited around 85% (roughly 90% Availability × 95% Performance × ~99.9% Quality). But the absolute number matters far less than the trend and the factor breakdown — a line moving from 55% to 65% by killing minor stops is doing real work, whatever the headline says.
How do you calculate OEE? OEE = Availability × Performance × Quality. Availability = run time ÷ planned production time; Performance = (ideal cycle time × total count) ÷ run time; Quality = good count ÷ total count. Multiply the three.
What's the difference between OEE and takt time? OEE measures how effectively the equipment ran against its own potential. Takt time measures whether you're keeping pace with customer demand. A line can have great OEE and still miss takt (the machine runs beautifully but too slowly for demand), or hit takt with mediocre OEE (lots of slack covering the losses). You need both lenses.
Why is my OEE so low when the line seems busy? Usually minor stops and reduced speed — the Performance losses that feel like "running" but aren't running at rate. They rarely show in the logbook, so a busy-feeling line can quietly sit at 60% Performance. Watching the line at the gemba is the only way to see them.
Should every machine have an OEE target? No. OEE pays off on the bottleneck, where lost minutes mean lost output. On non-constraint equipment, pushing OEE up just produces ahead of demand — overproduction. Measure where capacity is genuinely scarce.
Related concepts & guides
- Dictionary: OEE · Availability · Six Big Losses · Minor Stops · Total Productive Maintenance
- Guides: How to Use Takt Time in Manufacturing — OEE tells you how well the equipment ran; takt tells you whether it ran fast enough for demand.
Sources
- Nakajima, S., Introduction to TPM: Total Productive Maintenance — the origin of OEE and the six big losses framework.
- Vorne, OEE: A Practical Guide to Calculating OEE