

A3 Problem Solving in Manufacturing
An A3 is an 11-by-17-inch sheet of paper that forces a factory team to stop arguing, stand on the shop floor, and systematically eliminate the technical causes of chronic defects. Grounded in the Plan-Do-Check-Act discipline, this guide traces a real automotive body shop crisis on Framing Line 2—undersized weld nuggets on the inner B-pillar reinforcement at station BS-240—from the first andon pull and tier board escalation through the mess of multiple root causes spanning stamping and body assembly. Watch how flawed drafts transform through coaching into airtight countermeasures, how physical trials isolate the true fixes, and how the same seven-box template scales from a single robot cell to a plant-wide chassis bracket value stream.
What an A3 is on the shop floor
Named after standard 11-by-17-inch paper, an A3 is not a report to file away; it is an active thinking tool built on Plan-Do-Check-Act (PDCA) and displayed directly at the cell. The left column captures the current reality: why the defect matters to plant safety or customer delivery, the verified gap between standard and actual performance, and the underlying physical causes proven at the station. The right column lays out the experimental countermeasures, testing data, and standardized work required to lock in the gains. Because the entire story must fit on one sheet, it forces clarity and honest conversation. An author cannot hide behind twenty-page slide decks or write it from an office cubicle—they take a pencil to the line, run experiments alongside operators, and use the page as a continuous coaching dialogue.
Do not write an A3 for every isolated stoppage, broken bit, or nuisance fault that occurs during a run. Daily hiccups belong on the hourly production board and should be resolved through standard tier-one containment within minutes. You pull an A3 when a defect becomes chronic—when it survives shift handoffs, defies obvious quick fixes, bleeds scrap week after week, and demands joint investigation across stamping, maintenance, controls, and quality. Read the full definition in the A3 problem solving entry, and the cycle it follows under PDCA.
The three kinds of A3 you will run into on the floor
The 11-by-17 sheet never changes, and neither does the disciplined left-to-right logic. What changes is your scope: whether you are investigating a chronic defect at a single fixture, clearing stagnant inventory choking two departments, or pitching a capital project to the plant manager.
- The single-point problem-solving A3. The plant floor's daily workhorse. It zeroes in on a stubborn technical failure or repeating line stoppage at a single station—like undersized weld nuggets at station BS-240, a leaking pneumatic cylinder, or a scanner fault. You open one when standard work is defined, but the line keeps deviating from standard.
- The value-stream or flow A3. This steps back from individual clamps and guns to follow material and information flow across the full production line. Instead of hunting one defective joint, it tackles why days of work-in-process sit queued between stamping and framing, why tool changeovers drag on, and where takt pacing falls apart.
- The proposal or strategy A3. Used to align production, tooling, quality, and plant management before anyone cuts metal or signs a purchase requisition. It frames a clear business problem, evaluates competing technical countermeasures with real shop-floor data, and builds consensus before capital is committed.

How a line problem earns an A3
From an andon pull to a chronic bar
An andon cord pull answers an immediate flare-up. The team leader steps into the station within takt time, clears the fault, and records the lost pieces and minutes on the hour-by-hour board. At the end of the week, the team rolls those tick marks into a Pareto chart. Sporadic issues rise and drop as coils or shifts change, but occasionally one stubborn bar stays locked at the top of the chart. The board and the cord each have their own guide: the hour-by-hour board and andon.
On Framing Line 2 at station BS-240, undersized weld nuggets and severe weld spatter blow-out on the Inner B-pillar reinforcement have led downtime charts for 6 straight weeks. The team leader dresses the electrode caps, chisels spatter, and restarts weld gun 2 every shift, but destructive tear-down audits still measure nuggets averaging 3.6 mm against the 4.5 mm minimum specification. Daily line containment cannot fix a chronic defect driven by multiple interacting physical causes. That recurrence is what qualifies the problem for an A3.
Three visual displays that make the escalation call
These three visual controls hang directly beside station BS-240 on Framing Line 2. Together, they demonstrate why quick counter-checks during the shift are no longer enough and root-cause investigation must begin.
Hour-by-hour board
| Hour | Plan | Actual | Cum. | Andon reason |
|---|---|---|---|---|
| 07:00 - 08:00 | 50 | 50 | 50 | |
| 08:00 - 09:00 | 50 | 42 | 92 | E-314 spatter, stuck tips gun 2 |
| 09:00 - 10:00 | 50 | 38 | 130 | E-314 spatter, stuck tips gun 2 |
| 10:00 - 11:00 | 50 | 50 | 180 | |
| 11:00 - 12:00 | 50 | 41 | 221 | E-314 spatter, stuck tips gun 2 |
| 12:00 - 13:00 | 50 | 35 | 256 | E-314 spatter, stuck tips gun 2 |
| 13:00 - 14:00 | 50 | 44 | 300 | E-314 spatter, stuck tips gun 2 |
| 14:00 - 15:00 | 50 | 50 | 350 |
Review this board continuously through the shift to catch emerging hourly deficits and read the operators' verbatim stoppage notes before shift handover.
The line missed the 50-piece target in 5 out of 8 hours, dipping to 35 units. Every shortfall note lists 'Robot stop code E-314 for weld spatter blow-out and stuck tips on gun 2.'
Pareto of reasons
Consult this Pareto during the weekly team reflection meeting to separate normal shift variation from dominant, recurring failure modes.
'B-pillar weld expulsion' leads with 44 calls, followed by 'Emergency electrode cap dressing' at 22 calls, 'Gun 2 tip sticking' at 14 calls, 'Panel clamp fit-up gap alarm' at 12 calls, and 'Weld controller fault E-314' at 8 calls.
Calls by week
Track this run chart during weekly reviews to determine whether an elevated bar is a short-lived anomaly or an entrenched, worsening process drift.
Weekly calls climbed steadily from 68 in Week 31, to 74 in Week 32, 82 in Week 33, 79 in Week 34, 88 in Week 35, and 95 in Week 36, proving the defect is chronic and immune to routine tip dressing.
Contain the hourly stop at the cell. Log the failure code on the Pareto. Launch an A3 the moment one bar survives two consecutive weekly reviews.

Define the factual performance gap before discussing causes or cures
State what is failing, where it happens, and how far it drifts from standard
A disciplined problem statement names the specific defect, the line and station number, the quantified failure rate, and the engineering standard. It excludes hunches, operator blame, and pre-packaged equipment purchases. Starting Box 1 with an equipment upgrade or a maintenance request bypasses direct observation before anyone picks up calipers or observes the cycle on the floor.
Replace the weld tip dresser and reprogram robot weld gun 2 at station BS-240 because poor welding is causing spatter and excessive line stops on Framing Line 2.
This is a purchase request and an assumed fix masquerading as a problem statement. What measurable defect is occurring, on which component, and what is the recorded variance against the engineering standard?
Weld quality on the Inner B-pillar reinforcement at station BS-240 has deteriorated over the past 6 weeks, driving unacceptably high offline rework and scrap on Framing Line 2.
'Deteriorated' and 'unacceptably high' are impressions rather than data. Which specific welds are failing, what is the measured defect rate, and what exact specification defines acceptable?
Over the past 6 weeks on Framing Line 2, teardown audits of 120 assemblies per day reveal a 3.4% defect rate of undersized weld nuggets on the Inner B-pillar reinforcement at station BS-240. The failures concentrate on Weld 7, Weld 8, and Weld 9, where measured nugget diameters average 3.6 mm against the 4.5 mm minimum product specification. The plant standard is 0.0% undersized welds, and the condition has generated 1,110 minutes of offline rework.
Eliminate weld flaws on the Inner B-pillar reinforcement at station BS-240 and drastically reduce offline repair time.
A target condition must provide a verified metric, a baseline, a target value, and a hard deadline. What number defines success, and by what date will the cell sustain it?
Reduce the defect rate of undersized weld nuggets on Welds 7, 8, and 9 of the Inner B-pillar reinforcement at station BS-240 from 3.4% to 0.0% (all nuggets measuring at or above the 4.5 mm minimum specification) by October 18, eliminating 1,110 monthly rework minutes.

Why station BS-240 cannot wait another shift
Tie the chronic weld defect directly to structural risk and lost shift volume
A credible background establishes why this specific breakdown on Framing Line 2 commands immediate engineering focus over competing factory priorities. Strip out generic corporate pledges about safety or quality culture. Instead, quantify the six-week escalation, document the disruption to downstream assembly flow, and outline the exact cost in lost takt and rework time when station BS-240 fails.
Maintaining weld integrity is essential for passenger safety and reflects our plant's dedication to zero-defect manufacturing excellence, so station BS-240 on Framing Line 2 requires immediate countermeasure deployment to reach zero defects.
This is an aspirational mission statement, not an operational background. Every station in body assembly is supposed to be safe and zero-defect. Why pull cross-functional resources to station BS-240 today? We need the exact operational impact: which part, which welds, how long it has been chronic, what audits catch, and how many minutes of manual rework it inflicts on the plant.
On Framing Line 2, automated station BS-240 resistance-welds the Inner B-pillar reinforcement, a structural component critical for passenger cabin integrity during side impacts. Destructive teardowns and ultrasonic audits sample 40 assemblies per shift (120 per day), where engineering specifications mandate a 4.5 mm minimum nugget diameter against a standard of 0.0% defects. Over the past 6 weeks, undersized weld nuggets averaging only 3.6 mm across Weld 7, Weld 8, and Weld 9 have produced an unsustainable 3.4% defect rate. In addition to creating severe compliance risk if an undersized weld escapes to paint and final assembly, this defect has generated 1,110 minutes of offline manual rework and triggered repeated robot stops for expulsion and tip sticking on gun 2. Stabilizing BS-240 is urgent to protect passenger safety compliance and restore standard line throughput.

Map the physical reality at the station
Step onto the floor and quantify what the metal is doing
A credible current state is not built from memory or gathered in an engineering meeting room. Walk down to station BS-240 on Framing Line 2 with the team leader and weld technician. Watch fifty cycles uninterrupted. Measure the sheet fit-up gap before the gun clamps, check the electrode tip face diameter with a carbon burn, and log the teardown dimensions from daily audits. When you map what is physically taking place at the part, debate ends and the actual mechanism starts to show itself. Standing at the station is its own discipline. See how to do a gemba walk in manufacturing.
Station BS-240 on Framing Line 2 is programmed to clamp the Inner B-pillar reinforcement at 3.6 kN and run weld schedule 240-A to deliver 4.5 mm minimum nuggets across all nine spot positions.
This describes what the standard operating sheet says should happen. What did you actually measure when gun 2 closed on the assembly at the station today?
Press shop panels stamped on die B have poor flange geometry, causing fit-up issues that operators at BS-240 cannot correct before welding.
You are assigning blame to Stamping without data. Take a feeler gauge to station BS-240: what is the measured gap between the sheets, and does it occur on every weld location or only specific spots?
Chiseled destructive teardowns of 40 sampled assemblies per shift (120 per day) show Weld 1, Weld 2, and Weld 3 consistently exceed 5.0 mm, while Weld 7, Weld 8, and Weld 9 average only 3.6 mm against the 4.5 mm minimum specification. Feeler gauge measurements on 30 consecutive Inner B-pillar reinforcements from Stamping die B reveal a 0.9 mm air gap across flange positions 7 through 9 before clamp engagement. Carbon burn impressions show gun 2 electrode caps worn to a 6.8 mm face diameter versus the 6.0 mm nominal tooling standard.
Visual layouts for current state evidence
Different questions demand different visual formats. These four views analyze the physical conditions at station BS-240, turning raw shop floor measurements into unambiguous visual proof of where the process breaks down.
Process map
Use a process layout when defects generated in an upstream operation only surface during downstream assembly or audit.
Inner B-pillar reinforcements stamped on die B arrive at station BS-240 with an uncompensated flange gap. Gun 2 fires across the 0.9 mm gap, expelling metal, but the undersized weld is only verified when audit teardowns destroy 40 samples per shift.
Bar chart
Use a bar chart with an engineering limit line to compare discrete physical positions against a hard pass/fail boundary.
Weld 1, Weld 2, and Weld 3 comfortably pass between 5.0 mm and 5.3 mm. Weld 7, Weld 8, and Weld 9 fall below the 4.5 mm minimum threshold, clustering at an average diameter of 3.6 mm.
Run chart
Use a run chart over calendar weeks to establish whether an issue is an isolated breakdown or a chronic, embedded drift.
Weekly andon calls climbed steadily from 68 in Week 31 to 95 in Week 36 across 6 chronic weeks, while the defect rate remained frozen at 3.4%, proving the line was chronically unstable rather than suffering an acute one-off fault.
Pareto
Use a Pareto chart to separate the vital few operational disruptions from secondary symptoms.
B-pillar weld expulsion generated 44 calls, and emergency electrode cap dressing caused 22 calls. Together with 14 calls for gun 2 tip sticking, these three related thermal symptoms account for 80% of all line alarms at the cell.

Walking the pencil draft across three departments
A chronic defect rarely lives inside the department that catches it
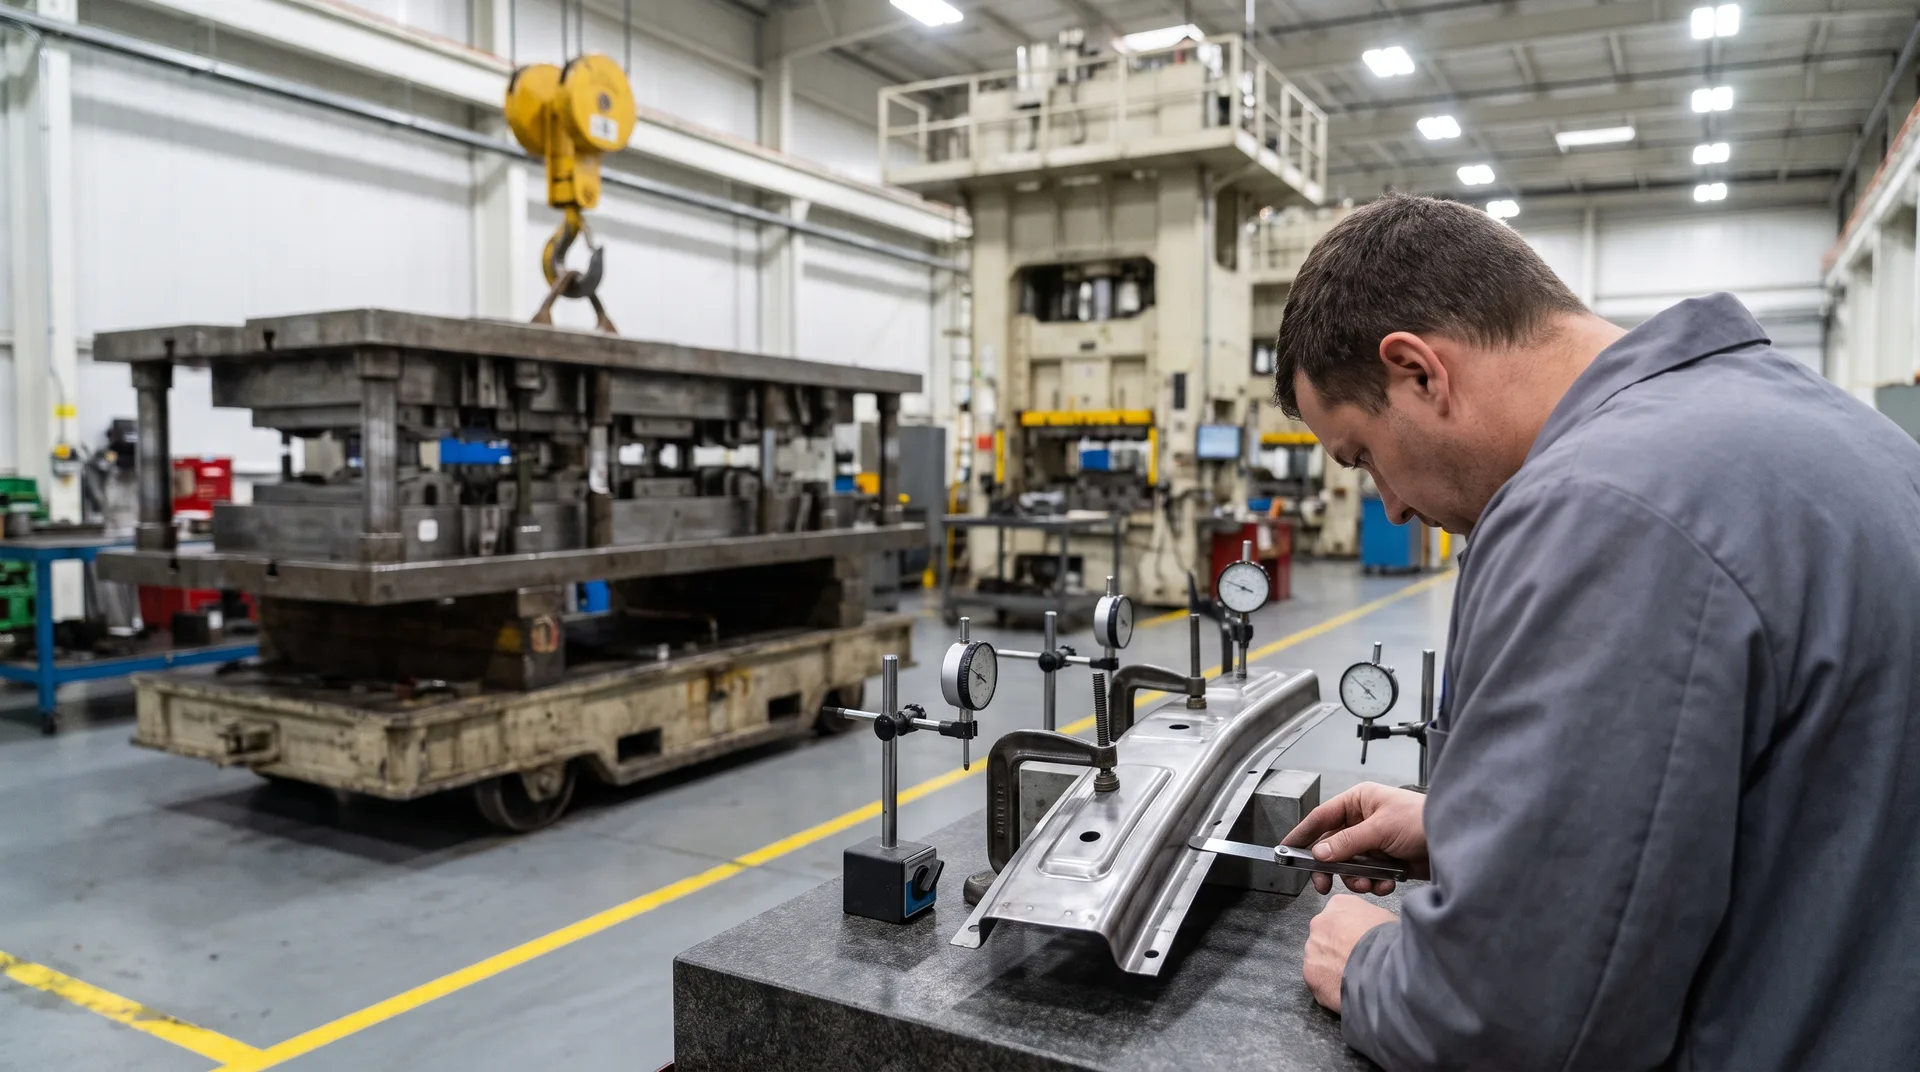
Quality flags undersized weld nuggets on the inner B-pillar reinforcement during destructive teardown. Welding blames Stamping for sheet gap variation at station BS-240. Stamping insists the panels match nominal contour, pointing back to robot gun maintenance and electrode cap wear. Controls notes intermittent E-314 fault codes but leaves expulsion detection on log-only to protect line tact. When each department isolates itself behind its own handoff, the true failure mode hides in the seams. The A3 forces all three functions onto the Framing Line 2 floor together.
Never email this problem-solving sheet as a digital report. Walk the physical paper draft directly between the stamping press, the weld maintenance shop, the controls cabinet, and the quality lab. Hand a pencil to the tooling lead, the robot programmer, and the teardown inspector so they can critique the problem breakdown in real time. If the operators and technicians who fight robot stop code E-314 every shift do not see their exact physical reality reflected on the paper, your countermeasures will fail. The dictionary covers nemawashi in full.
Stamping Tooling Lead: “We recut die B without the CAD springback compensation after the last die crash. That explains the 1.8° flange deviation and the 0.9 mm gap across welds 7, 8, and 9.”
Weld Process Engineer: “The tip dresser cutter blade is severely worn, expanding cap faces to 6.8 mm instead of 6.0 mm. Without stepper schedule 240-L active, current density drops below fusion.”
Controls Engineer: “The weld controller logged 44 expulsion calls and 8 E-314 faults, but the monitor is set to log-only instead of line interlock. Cold welds are escaping downstream unchecked.”
Teardown Audit Inspector: “We audit 40 assemblies per shift for 120 per day. Welds 1, 2, and 3 tear full buttons, but welds 7 through 9 measure only 3.6 mm against our 4.5 mm minimum specification.”
Framing Line 2 Team Leader: “Gun 2 sticks on the inner B-pillar reinforcement constantly, driving 22 emergency cap dress stops. Don't blame our operators for adjusting force when the sheet gap is this bad.”
Isolate the physical mechanisms behind the defect
Bypass human blame to uncover mechanical physics
When a line runs scrap, the easiest explanation is always human error: an operator skipped an inspection, maintenance missed a PM, or a new hire was poorly trained. Those explanations lead straight to retrained operators and zero lasting change. Real root cause analysis strips away behavior until you reach contact area, sheet deflection, electrical impedance, and sensor parameters. On high-speed assembly lines, chronic defects almost never stem from one clean smoking gun. They survive because two or three sub-optimal machine conditions quietly stack together until parts dip below the tolerance floor. The tools are the 5 Whys, the fishbone diagram, and root cause analysis as a whole.
Second-shift maintenance technicians failed to dress the electrode caps on station BS-240 gun 2, and operators ignored the spatter buildup.
This blames people and assumes human negligence caused the undersized nugget. What physical parameter degrades when electrode caps mushroom, and why did the gun fail to fuse the steel at that exact flange location?
Standard work SOP-W24 lacks a defined cutter replacement frequency, causing station BS-240 to run dull tip dresser tooling.
A missing binder page does not stop steel from melting. Trace the exact mechanical consequence: what contact face diameter did the cutter leave on the caps, and how did that geometry alter the weld current density?
Three physical conditions converge at station BS-240 to produce undersized nuggets on the inner B-pillar reinforcement. First, stamping die B was recut without CAD springback compensation, yielding a 1.8° flange angle deviation that forces a 0.9 mm sheet air gap specifically across welds 7 through 9. Second, mechanical wear on the tip dresser cutter blade has broadened electrode cap contact faces from the nominal 6.0 mm to 6.8 mm; because the automated current stepper curve on schedule 240-L is inactive, this increased surface area dilutes current density below the fusion threshold across that 0.9 mm air gap. Third, the weld controller's expulsion detection system is configured to log-only rather than line-stop interlock, allowing cold 3.6 mm nuggets to travel downstream into Framing Line 2 unnoticed.
Three methods to dissect technical failure modes
Select your root-cause tool based on whether the defect stems from a single progressive failure, a web of unvalidated variables, or an interaction between multiple simultaneous equipment drifts.
5 Whys
Ideal for drilling through a linear, single-thread mechanical or electrical failure chain.
The 5 Whys moved past operator shift disputes and pinpointed the uncompensated CAD file used during the June stamping die maintenance.
Fishbone
Ideal when multiple shop floor variables could explain the variance and each must be physically confirmed or disproven.
Destructive coupon testing eliminated steel metallurgical variation and air cylinder clamping pressure, narrowing the defect to tip geometry and flange gap.
Chain of conditions
Essential for chronic defects that only occur when two or more distinct process parameters drift simultaneously.
The interaction map confirmed that the 0.9 mm gap produced acceptable nuggets with fresh 6.0 mm caps, proving the defect required both air gap and diluted current density to manifest.

Address each verified condition and lock in the gain
Target root causes with physical changes, not reminders or more audits
Retraining operators and posting caution placards will not close a 0.9 mm air gap or restore worn electrode cap geometry. Real lean countermeasures modify the physical capability of the equipment and tooling so defects become impossible to produce or immediately flagged. For station BS-240 on Framing Line 2, the team matched each confirmed root cause to an engineered intervention: re-machining stamping die B to eliminate flange springback, installing fresh 6.0 mm cutter blades paired with current stepper schedule 240-L, and turning the weld controller's expulsion monitor into an automated line interlock. Each countermeasure was assigned to a single technical owner with firm completion dates between October 4 and October 12. Mistake-proofing has its own entry: poka-yoke. So does the thing a countermeasure becomes once it holds: standard work.
Brief all weld technicians on listening for spatter blowout, add an extra teardown audit per shift, and request production to slow Framing Line 2 whenever gun 2 tips stick.
Briefings, extra audits, and line slowdowns merely ask people to endure a defective process. None of these actions eliminate the 0.9 mm flange gap, dress the mushroomed 6.8 mm electrode caps, or halt cold welds automatically. What physical changes directly eliminate each of the three verified root causes?
| Action | Owner | Due |
|---|---|---|
| Re-machine stamping die B flange steels with 1.8° overbend springback compensation to eliminate 0.9 mm gap. | Stamping Tooling Lead | October 4 |
| Install fresh 6.0 mm dresser cutter blade and calibrate automated current stepper schedule 240-L. | Weld Process Engineer | October 8 |
| Reconfigure weld controller expulsion monitor from log-only to line-stop interlock mode. | Controls Engineer | October 12 |
Validating countermeasures in isolated trials before full implementation
Deploying three technical modifications simultaneously conceals what actually works and risks introducing secondary defects. The team conducted structured trials on Framing Line 2 using batches of 120 Inner B-pillar reinforcement assemblies per day (40 parts sampled per audit). By testing the recut die, the tip dresser with stepper schedule 240-L, and the expulsion interlock independently and in combination, the team isolated how each factor influenced weld nugget diameter and expulsion events.
Trial matrix
| Trial | Die recut | Tip & stepper | Interlock | Result |
|---|---|---|---|---|
| Trial 1: Baseline | Off (0.9 mm gap) | Off (6.8 mm worn) | Log-only | 3.4% defect; mean nugget 3.6 mm |
| Trial 2: Die recut | On (zero gap) | Off (6.8 mm worn) | Log-only | -70% tear-outs; nuggets < 4.5 mm |
| Trial 3: Tip/stepper | Off (0.9 mm gap) | On (6.0 mm & 240-L) | Log-only | 1.8% defect; severe expulsion |
| Trial 4: Combined | On (zero gap) | On (6.0 mm & 240-L) | Log-only | Mean 5.1 mm; 0 expulsions |
| Trial 5: Interlock | Off (0.9 mm gap) | Off (6.8 mm worn) | Line interlock | 3.4% defect; 100% halted at BS-240 |
Use an experimental matrix whenever a defect has multiple physical causes and you must verify the independent contribution of each countermeasure before production sign-off.
Trial 2 showed die recutting cut tear-outs by 70%, but nuggets still dropped below 4.5 mm as caps wore. Trial 3 restored current density but suffered heavy expulsion across the 0.9 mm gap (1.8% defect rate). Only Trial 4's combination achieved 5.1 mm mean nuggets with zero expulsion across 360 test assemblies, while Trial 5 proved the interlock stops 100% of non-conforming assemblies at station BS-240.
Before and after
Use a before-and-after distribution comparison to prove that process centering and spread have moved safely clear of the minimum engineering limit.
Baseline inspection showed a 3.6 mm mean nugget diameter with failing welds sinking to 2.8 mm across welds 7 through 9, driving a 3.4% defect rate and 1,110 rework minutes. After implementing the recut die B and calibrated stepper schedule 240-L, mean nugget diameter rose to 5.1 mm, with all 360 teardown samples measuring 4.6 mm or greater.
Have the team leader check the B-pillar welds when time permits, log any expulsion calls on the daily whiteboard, and talk to stamping if panels fit poorly again.
A vague request like 'check when time permits' will collapse within forty-eight hours under production pressure. Specify who audits station BS-240, the precise sample size (such as the 40-part audit sample), the exact 4.5 mm threshold, and the mandatory containment procedure if an E-314 fault or undersized nugget recurs.
Quality leads destructively chisel-check 40 sampled parts per audit across 120 daily assemblies at station BS-240, logging nugget diameters for welds 7, 8, and 9 on the hourly SPC chart. If any nugget measures below the 4.5 mm minimum, the controller line-stop trips and the Weld Process Engineer must respond within 15 minutes. Cutter wear check added to daily PM at 6.0 mm face gauge; stamping die B CAD model updated with 1.8° overbend into stamping standard DMS-084. At 30 days: 0.0% defect rate, zero expulsion stops, and rework reduced from 1,110 minutes to zero.

Zooming out from station BS-240 to the entire door-to-door line
Value stream transformation A3
Stabilizing the weld nuggets at station BS-240 resolved an urgent quality failure, but a plant does not deliver isolated welds—it delivers finished components. A transformation A3 takes the exact same problem-solving discipline and applies it across the wider production system. For the chassis bracket family, that means tracking material from incoming master steel coils through press blanking, stamping, robotic welding, wash, and dock pack-out. Adding up the total touch time across all machines reveals just 38 minutes of active processing. Yet a piece of steel takes 26.4 days to exit the building. The map itself is taught in value stream mapping.
The chasm between 38 minutes of work and 26.4 days of lead time comes down to batching and schedule disconnection. Because die swaps on the stamping press take 90 minutes of downtime, tooling operators stamp 14,000 pieces in a single run to keep machine utilization high. Unsynchronized ERP schedules push independent targets down to stamping, welding, and assembly, turning aisles into holding pens for wire baskets. When the customer releases an order within their 4-day window, plant dispatchers must expedite parts and reshuffle schedules. Countermeasures focus on coupling these operations: cutting press changeovers under 20 minutes, pulling from a 1,800-piece supermarket, feeding weld through FIFO lanes, and establishing pack-out as the single pacing heartbeat. The changeover work is SMED. The pull signal is kanban.
Current state versus future state value stream maps
These maps trace the chassis bracket through two structural operating models. The upper flow shows how scheduling instructions enter each cell, while the lower timeline contrasts value-adding machine touch time against days of dormant queue inventory.
Current state
Walk the door-to-door pathway with area supervisors when expediting, missed customer delivery windows, and crowded aisles demonstrate that optimizing individual machines has failed.
Chassis brackets receive only 38 minutes of active forming, welding, and washing across nearly four weeks on site. The remaining time is spent waiting in 14,000-piece batch queues.
Future state
Draft this blueprint before spending capital on storage racks or relocating equipment, ensuring all department leaders agree where buffer stock is allowed to live.
Die changeovers drop under 20 minutes, allowing stamping to produce in 1,800-piece cycles. Pull signals pull material smoothly through three tightly linked loops.
The sheet
| Box | On the sheet |
|---|---|
| 1. Background | Chassis bracket lead time is 26.4 days vs 4-day customer window; plant logged 12 emergency freight runs. |
| 2. Current State | Only 38 min of touch time across 26.4 days; 90-min die swaps force 14,000-pc batches and $410k WIP buffer. |
| 3. Target Condition | Compress lead time from 26.4 to 6.0 days in 6 months, secure 4-day customer window, and cut floor WIP by 60%. |
| 4. Root Cause | Pushed ERP schedules disconnect cells; 90-min setups force 14,000-pc batches; no physical FIFO aisle limits. |
| 5. Countermeasures | SMED to cut die swaps under 20 min for 1,800-pc supermarket; 40-tote FIFO lane; pack-out heijunka pacemaker. |
| 6. Implementation | Execute Loop 1 SMED; roll out Loop 2 FIFO only after setups stay under 20 min for 4 consecutive weeks. |
| 7. Follow-up | Weekly obeya reviews audit lead time and supermarket min/max levels; lock standard work in plant procedures. |
Review this living document during weekly operational stand-ups to track loop milestones, clear inter-department roadblocks, and sustain standard work.
The target condition cuts lead time from 26.4 days to 6.0 days, directly securing the 4-day customer order window through targeted SMED, FIFO queues, and daily leveling.
- 1. Background and problem statement Door-to-door lead time for the chassis bracket family averages 26.4 days against an agreed customer delivery window of 4 days. The facility holds $410,000 in work-in-process buffer inventory and logged 12 emergency hot-shot freight shipments last quarter to protect customer assembly plants.
- 2. Root cause analysis Production control broadcasts independent weekly push schedules to stamping, welding, and pack-out. A 90-minute die changeover compels the press to run 14,000-piece batches. Aisle staging areas lack physical FIFO boundaries, allowing older totes to be buried while hot batches jump ahead.
- 3. Target condition Compress door-to-door lead time from 26.4 days down to 6.0 days within six months. Maintain 100% on-time delivery to the 4-day customer window with zero expedited freight runs and reduce floor inventory by 60%.
- 4. Countermeasure loops Loop 1: Apply SMED to cut stamping die changeovers from 90 minutes to under 20 minutes, supporting a 1,800-piece kanban supermarket. Loop 2: Install a 40-tote gravity FIFO lane connecting weld to wash. Loop 3: Designate pack-out as the line pacemaker leveled through a daily heijunka box.
- 5. Implementation and review cadence The value stream leader and cross-functional owners audit supermarket min/max levels and lead-time metrics weekly at the obeya board. Loop 2 FIFO installation initiates only after Loop 1 sustains changeovers under 20 minutes for four consecutive weeks without a line interruption.
Steps to complete an A3 on the line
Do not draft an A3 in an office cubicle from memory. Walk to the Framing Line 2 daily tier board, take the defect that has dominated scrap pareto charts for 6 consecutive weeks—undersized weld nuggets on the inner B-pillar reinforcement at station BS-240—and run the discipline on physical paper at the cell.
- 1Isolate the chronic defect and assign a single line ownerPull the top issue off the Framing Line 2 board: undersized weld nuggets at station BS-240, which generated 1,110 rework minutes over 6 chronic weeks. Designate a single owner—not a committee—to carry the physical paper clipboard, coordinate across stamping and maintenance, and run the problem to ground.
- 2Quantify the baseline gap against engineering standardDefine the performance gap with physical measurements rather than general complaints. Record that destructive teardowns show a 3.4% defect rate against a 0.0% standard, with Welds 7, 8, and 9 averaging only 3.6 mm against the 4.5 mm minimum specification, while Welds 1, 2, and 3 pass cleanly.
- 3Observe the live cycle at the station to collect physical evidenceStand at station BS-240 across full production shifts. Track robot stop code E-314, watch Gun 2 blow spatter and stick tips, log the 44 expulsion calls, and measure the physical air gaps on inner B-pillar reinforcement panels coming out of stamping die B before any weld current fires.
- 4Set an unambiguous target condition and strict completion dateState the target without ambiguity: shift nugget diameter from 3.6 mm to above the 4.5 mm minimum specification across all welds, cut the 3.4% defect rate to the 0.0% standard, recover 1,110 rework minutes, and achieve line sign-off across stamping, weld, and controls by October 12.
- 5Map the multi-variable technical causes across departmentsEngage stamping, tooling, and weld engineering to map the full failure mechanism. Document how die B flange springback creates a 0.9 mm gap, tip dresser wear mushrooms caps to 6.8 mm without current stepper schedule 240-L, and log-only expulsion monitors allow cold nuggets to escape downstream.
- 6Execute isolated countermeasure trials to verify interactionsTest each countermeasure sequentially instead of throwing changes in all at once. Run controlled lots to demonstrate why die recutting or tip dressing alone fails to clear the 4.5 mm threshold, and verify that combining the 1.8° overbend with fresh 6.0 mm cutters and schedule 240-L reaches 5.1 mm.
- 7Standardize line parameters, error-proofing, and audit routinesLock in the gains by switching the weld controller expulsion monitor to line-stop interlock mode, updating the tip dresser blade PM schedule, locking stepper schedule 240-L in standardized work, and verifying audit results across 120 samples per day before closing the sheet.
Health check for the sheet
Before taking your pencil draft to the line sponsor or operations manager, walk the clipboard back down to station BS-240. Audit your seven boxes against these six shop-floor realities to ensure the sheet describes physical facts rather than conference room assumptions.
- The problem statement defines a measurable gap, not a disguised purchase order. Verify that box 2 measures the exact distance between actual performance and standard—such as 3.4% undersized welds versus 0.0%, or 3.6 mm nugget diameter against the 4.5 mm minimum. If your text asks for new weld guns, software modules, or more maintenance heads, erase it and rewrite the operational delta.
- Every data point was verified at the fixture, not compiled from an office desk. Confirm that teardown measurements, robot E-314 fault tallies, and hourly piece-counts were observed and calculated directly on Framing Line 2. If your Pareto chart depends on end-of-shift scrap logs or filtered ERP downloads instead of physical part audits at the cell, return to the floor and re-verify the numbers.
- Root causes terminate in tooling geometry, metallurgy, and control limits. Ensure your breakdown lands on mechanical, thermal, and configuration realities—such as a 0.9 mm sheet gap from stamping die springback, 6.8 mm expanded electrode face wear, and inactive current steppers. If your analysis concludes with 'operator did not notice expulsion' or 'lack of training,' the technical investigation is unfinished.
- Nemawashi marks from upstream and downstream trades are visible on the paper. Check that the stamping toolmaker, weld process engineer, cell millwright, and line operator have reviewed the sheet and scribbled corrections in pencil. If an A3 arrives in management review without thumbprints, grease smudges, and marginal debate from stamping and maintenance, it represents an isolated opinion rather than team consensus.
- Countermeasures were isolated in controlled trials before being combined. Review box 5 to confirm that fixes were tested step-by-step rather than dumped into production simultaneously. If you recut the stamping die, replace the cutter blade, activate stepper schedule 240-L, and enable line interlocks in a single unmonitored weekend, you will never know which variable stabilized the weld fusion.
- Sustaining relies on physical interlocks and preventive routines, not vigilance. Ensure the final box locks in permanent operational barriers rather than gentle reminders. Success requires re-machined die steel, a locked-in dresser cutter replacement interval, automated current stepper curves, and weld controllers reconfigured to halt the line rather than quietly write an error log.
Six mistakes that derail a manufacturing A3
Most abandoned A3s do not fail because the root causes were impossible to find. They stall because the team fell into one of six predictable habits during the shop-floor investigation.
- Smuggling a predetermined solution into Box 1. Writing 'Need new weld guns at station BS-240' is not a problem description; it is a capital request disguised as lean problem solving. State the gap strictly in physical metrics: weld nuggets averaging 3.6 mm against a 4.5 mm specification, generating a 3.4% defect rate. Let the root-cause analysis determine whether the answer is a die re-cut, a tip dresser blade replacement, or a parameter change.
- Diagnosing station defects from an office computer. PLC cycle logs and MES fault histories confirm robot stop code E-314 fired, but they cannot tell you why expulsion blew out the sheet metal on gun 2. Go to Framing Line 2. Stand at station BS-240, observe twenty consecutive cycles, inspect the 6.8 mm mushroomed electrode faces, feel the 0.9 mm sheet air gap on welds 7 through 9, and speak directly with the shift setters.
- Stopping the 5 Whys at operator carelessness or retraining. Concluding an inquiry with 'retrain the setter' guarantees undersized nuggets will return on the following shift. If an operator can seat a flange with a 1.8° springback angle or run worn tip dresser cutters without a line alert, the manufacturing system permits the defect. Push past individual vigilance to find mechanical clearances, tool maintenance frequencies, and PLC interlock limits.
- Confusing a containment gate with a root-cause countermeasure. Adding an offline pry check or auditing 40 assemblies per shift at the framing exit protects the paint shop, but it burns 1,110 rework minutes and fixes zero root causes. Containment is an emergency tourniquet that buys thinking time. Countermeasures must permanently eliminate the physical mechanisms that drop nugget diameters below standard at the station itself.
- Testing multiple process variables simultaneously during production trials. Re-machining stamping die B, replacing the tip dresser cutter, and altering the current stepper curve all during the same maintenance window destroys test validity. If nugget sizes jump to 5.1 mm on Monday morning, the plant cannot verify which technical variable solved the gap, leaving maintenance and tooling unable to define stable operating envelopes.
- Authoring the A3 as an isolated single-department exercise. A weld engineer working alone will overlook stamping die springback; a stamping technician working alone will miss tip dressing intervals and current densities. Chronic defects cross departmental boundaries. If the stamping tool lead, weld process engineer, and line controls tech do not build the sheet together at the gemba, the countermeasures will fall apart within weeks.
Templates and tools for shop-floor teams
- Printable 11x17 A3 problem-solving canvas: Standard 11x17 template formatted with all seven problem-solving boxes, built-in run charts, target condition blocks, and countermeasure tracking tables ready for pencil notes at the cell.
- Hour-by-hour production and defect tracker: Track pitch-by-pitch output against plan, log robot stop codes and weld expulsion trips immediately, and build reliable Pareto data directly from operator andon calls.
- Multi-cause Ishikawa fishbone worksheet: Break complex chronic defects into distinct machine, tooling, material, and method branches so teams can isolate interacting factors like flange gap and electrode wear together.
- Plant-wide value stream mapping canvas: Map material and information flow from blanking through final assembly to highlight excess WIP buffers, measure changeover losses, and compress total order-to-delivery lead time.
Questions and answers about shop floor A3 problem solving
- What does A3 problem solving mean on a factory floor?
- An A3 is a disciplined problem-solving routine documented on a single 11-by-17-inch sheet of paper pinned directly beside the machine at the gemba. Structured around the Plan-Do-Check-Act cycle, it serves as a visual conversation between operators, maintenance technicians, and process engineers. Rather than generating bloated slide decks or defaulting to operator blame, the A3 forces the plant team to observe the physical process firsthand, quantify operational gaps with baseline data, and systematically isolate the multiple interacting tooling, equipment, and material variables that drive chronic shop floor failures.
- How does an andon pull earn a spot on an A3 sheet?
- The journey begins when an operator pulls the andon rope for an abnormal condition, such as robot stop code E-314 for weld blow-outs at station BS-240. The team leader applies immediate containment, logs the downtime on the cell's hourly production board, and tracks recurring stops. During weekly reviews, repeated calls aggregate into scrap and lost-time Pareto charts. When an issue turns chronic—such as weekly calls climbing from 68 to 95 over 6 consecutive weeks and generating 1,110 rework minutes—the department leader commissions a dedicated A3 to resolve the systemic root causes.
- How should a line team write an airtight problem statement in Box 1?
- A high-integrity problem statement defines the measurable gap between documented standard conditions and observed reality without speculating on causes or prescribing countermeasures. It defines what, where, when, and the exact magnitude. For example: 'On Framing Line 2 at station BS-240, tear-down audits show a 3.4% defect rate of undersized weld nuggets on the Inner B-pillar reinforcement against a 0.0% standard. Welds 7, 8, and 9 average 3.6 mm against the 4.5 mm minimum specification, generating 1,110 minutes of offline rework over the past 6 weeks.' This gives the team a concrete, quantifiable target to prove out.
- What separates a line-level problem-solving A3 from a value stream A3?
- A line-level problem-solving A3 zeroes in on a specific technical failure at a single station, such as defective weld nuggets at BS-240, using deep physical root-cause analysis to fix machine, tooling, and sensor parameters. A value stream A3 takes a macro view of an entire product family, such as the chassis bracket line. Instead of tuning weld schedules, it maps dock-to-stock material and information flow to compress total lead time from 26.4 days to 6.0 days, slash press changeovers from 90 minutes to under 20 minutes, and reduce batch sizes from 14,000 pieces to 1,800 pieces.
- How does an A3 report differ from an external customer 8D?
- An 8D is an external compliance document formatted to satisfy customer quality portals, governed by strict administrative sign-off milestones and contractual containment deadlines. An A3 is an internal shop-floor coaching and working tool written in pencil, owned by line workers and engineers right where parts are made. While both share the scientific method, the factory floor uses the A3 to run multi-factor countermeasure trials and verify machine-level physics, and then transposes those validated engineering results into the customer's formal 8D report.
Core lean concepts for problem solvers
Related manufacturing field guides
Shop-floor templates and calculators
Foundational lean reference texts
- Lean Enterprise Institute: The A3 Report Lexicon
- Managing to Learn: Using the A3 Management Process by John Shook
- Learning to See: Value Stream Mapping to Add Value and Eliminate Muda by Mike Rother and John Shook
- Understanding A3 Thinking: A Critical Component of Toyota's PDCA Management System by Durward K. Sobek II and Art Smalley
Founder of Kaizumi, an AI-powered Lean training platform. More about Matthew →
Updated September 2026 · Framing line 2, station BS-240, the bracket value stream, the people, the measurements, and the rates are a worked example built to be internally consistent, not a real plant or measured industry figures. The method reflects standard A3 practice as taught at Toyota and by the Lean Enterprise Institute. Photographs are illustrations of a generic plant.